
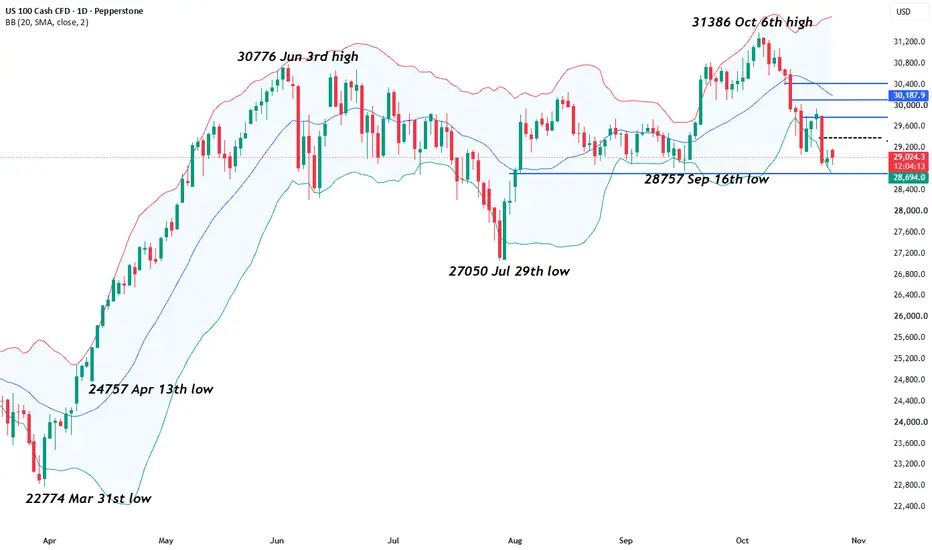
The US 100 took traders on another wild rollercoaster ride last week, with sharp sentiment swings highlighting just how nervous markets have become about the outlook for technology stocks. Having initially attracted renewed buying interest, the tech-heavy index rallied from opening levels at 29129 on Monday, up to a high of 29936 on Wednesday, before suffering a dramatic reversal on Thursday as renewed selling across AI-related stocks and chip manufacturers sent prices sharply lower. At the heart of the uncertainty lies a growing debate over whether the enormous sums being invested in artificial intelligence will ultimately deliver the returns investors have come to expect. Meanwhile, elevated oil prices, ongoing geopolitical tensions in the Middle East and concerns regarding the outlook for US interest rates have added further complications. With the US 100 closing on Friday at 28998, down 0.5% on the week, the big question could be whether the recent volatility represents an opportunity to rebuy the dip or a warning that the index’s impressive year to date rally could be running out of momentum.
Looking forward, if traders thought last week was challenging, the coming days could prove just as demanding, with a Federal Reserve (Fed) interest rate decision and more earnings from US tech giants threatening to deliver another round of price swings to the US 100 index. Wednesday's Fed interest rate decision (1800 GMT) and subsequent press conference (1830 GMT) may take centre stage, with traders searching for clues about whether policymakers remain concerned enough about persistent inflation to consider further tightening. Any unexpectedly hawkish comments could push Treasury yields higher and place renewed pressure on technology valuations.
However, the Fed is only part of the story, with Alphabet and Microsoft also scheduled to report their latest earnings on Wednesday (after close), followed by Amazon on Thursday (after close). With AI spending on data centres, cloud computing growth and future profit expectations firmly under the microscope, these results could prove crucial in determining whether confidence returns to the technology sector or recent selling pressures intensify. Strong earnings and reassuring forward guidance may provide the catalyst for another recovery, but any disappointment could quickly reignite concerns over stretched valuations.
Technical Update: Is the Slowing in Upside Momentum Significant?
When any asset successfully breaks and closes above a previous all-time high, it usually attracts significant interest and can often provide an important clue about market sentiment, as traders try to assess if the breakout will attract fresh buying interest to push prices higher into uncharted territory, or may fail to generate follow-through demand shifting the focus back to the downside.

As the chart above shows, this is perhaps the dilemma currently facing traders of the US 100 Index. Early October saw successful closing breaks above the previous all-time high of 30776 (June 3rd), leading to a new record peak of 31386 on October 6th. However, sellers soon regained control, triggering a decline of 8% from that high to last Friday’s low at 28852.
With the Fed rate decision and tech earnings potentially increasing volatility this week, identifying key support and resistance levels that may play a role in determining the next directional move of the US 100 could be a useful tool for decision making.
Potential Support Levels:
Following the decline from the October 6th all-time high at 31386, attention may now turn to a potential support area between 28757/28697. This range combines the September 16th correction low, and the 61.8% Fibonacci retracement of the rally seen between July 29th and October 6th.
Closing breaks below the 28757/28697 area could raise concerns that a more extended phase of weakness is developing, potentially leading to renewed downside momentum, especially given there appears to be little in the way of key support beneath this range until 27050, which is the July 29th low.
Potential Resistance Levels:
While the support area between 28757/28697 remains intact, there is scope for the latest sell-off to prove corrective in nature. However, closing breaks above key resistance levels may be required to signal that further upside is ready to develop again. The first resistance level to monitor this week could be 29381, which represents the mid-point of last week's sell-off range.
If prices were to achieve a close above 29381, this could open the way for a move towards 29805, the 38.2% retracement of the October decline. Closing breaks above 29805 may then increase potential to test 30109, the 50% retracement, and then 30419, the 61.8% retracement level.
The material provided here has not been prepared accordance with legal requirements designed to promote the independence of investment research and as such is considered to be a marketing communication. Whilst it is not subject to any prohibition on dealing ahead of the dissemination of investment research, we will not seek to take any advantage before providing it to our clients.
Pepperstone doesn’t represent that the material provided here is accurate, current or complete, and therefore shouldn’t be relied upon as such. The information, whether from a third party or not, isn’t to be considered as a recommendation; or an offer to buy or sell; or the solicitation of an offer to buy or sell any security, financial product or instrument; or to participate in any particular trading strategy. It does not take into account readers’ financial situation or investment objectives. We advise any readers of this content to seek their own advice. Without the approval of Pepperstone, reproduction or redistribution of this information isn’t permitted.
Looking forward, if traders thought last week was challenging, the coming days could prove just as demanding, with a Federal Reserve (Fed) interest rate decision and more earnings from US tech giants threatening to deliver another round of price swings to the US 100 index. Wednesday's Fed interest rate decision (1800 GMT) and subsequent press conference (1830 GMT) may take centre stage, with traders searching for clues about whether policymakers remain concerned enough about persistent inflation to consider further tightening. Any unexpectedly hawkish comments could push Treasury yields higher and place renewed pressure on technology valuations.
However, the Fed is only part of the story, with Alphabet and Microsoft also scheduled to report their latest earnings on Wednesday (after close), followed by Amazon on Thursday (after close). With AI spending on data centres, cloud computing growth and future profit expectations firmly under the microscope, these results could prove crucial in determining whether confidence returns to the technology sector or recent selling pressures intensify. Strong earnings and reassuring forward guidance may provide the catalyst for another recovery, but any disappointment could quickly reignite concerns over stretched valuations.
Technical Update: Is the Slowing in Upside Momentum Significant?
When any asset successfully breaks and closes above a previous all-time high, it usually attracts significant interest and can often provide an important clue about market sentiment, as traders try to assess if the breakout will attract fresh buying interest to push prices higher into uncharted territory, or may fail to generate follow-through demand shifting the focus back to the downside.
As the chart above shows, this is perhaps the dilemma currently facing traders of the US 100 Index. Early October saw successful closing breaks above the previous all-time high of 30776 (June 3rd), leading to a new record peak of 31386 on October 6th. However, sellers soon regained control, triggering a decline of 8% from that high to last Friday’s low at 28852.
With the Fed rate decision and tech earnings potentially increasing volatility this week, identifying key support and resistance levels that may play a role in determining the next directional move of the US 100 could be a useful tool for decision making.
Potential Support Levels:
Following the decline from the October 6th all-time high at 31386, attention may now turn to a potential support area between 28757/28697. This range combines the September 16th correction low, and the 61.8% Fibonacci retracement of the rally seen between July 29th and October 6th.
Closing breaks below the 28757/28697 area could raise concerns that a more extended phase of weakness is developing, potentially leading to renewed downside momentum, especially given there appears to be little in the way of key support beneath this range until 27050, which is the July 29th low.
Potential Resistance Levels:
While the support area between 28757/28697 remains intact, there is scope for the latest sell-off to prove corrective in nature. However, closing breaks above key resistance levels may be required to signal that further upside is ready to develop again. The first resistance level to monitor this week could be 29381, which represents the mid-point of last week's sell-off range.
If prices were to achieve a close above 29381, this could open the way for a move towards 29805, the 38.2% retracement of the October decline. Closing breaks above 29805 may then increase potential to test 30109, the 50% retracement, and then 30419, the 61.8% retracement level.
The material provided here has not been prepared accordance with legal requirements designed to promote the independence of investment research and as such is considered to be a marketing communication. Whilst it is not subject to any prohibition on dealing ahead of the dissemination of investment research, we will not seek to take any advantage before providing it to our clients.
Pepperstone doesn’t represent that the material provided here is accurate, current or complete, and therefore shouldn’t be relied upon as such. The information, whether from a third party or not, isn’t to be considered as a recommendation; or an offer to buy or sell; or the solicitation of an offer to buy or sell any security, financial product or instrument; or to participate in any particular trading strategy. It does not take into account readers’ financial situation or investment objectives. We advise any readers of this content to seek their own advice. Without the approval of Pepperstone, reproduction or redistribution of this information isn’t permitted.

Global risk Warning CFDs are complex instruments and come with a high risk of losing money rapidly due to leverage. Between 74-89% of retail investor accounts lose money when trading in CFDs. You should consider whether you understand how CFD
Declinazione di responsabilità
Le informazioni e le pubblicazioni non sono intese come, e non costituiscono, consulenza o raccomandazioni finanziarie, di investimento, di trading o di altro tipo fornite o approvate da TradingView. Per ulteriori informazioni, consultare i Termini di utilizzo.
Global risk Warning CFDs are complex instruments and come with a high risk of losing money rapidly due to leverage. Between 74-89% of retail investor accounts lose money when trading in CFDs. You should consider whether you understand how CFD
Declinazione di responsabilità
Le informazioni e le pubblicazioni non sono intese come, e non costituiscono, consulenza o raccomandazioni finanziarie, di investimento, di trading o di altro tipo fornite o approvate da TradingView. Per ulteriori informazioni, consultare i Termini di utilizzo.