
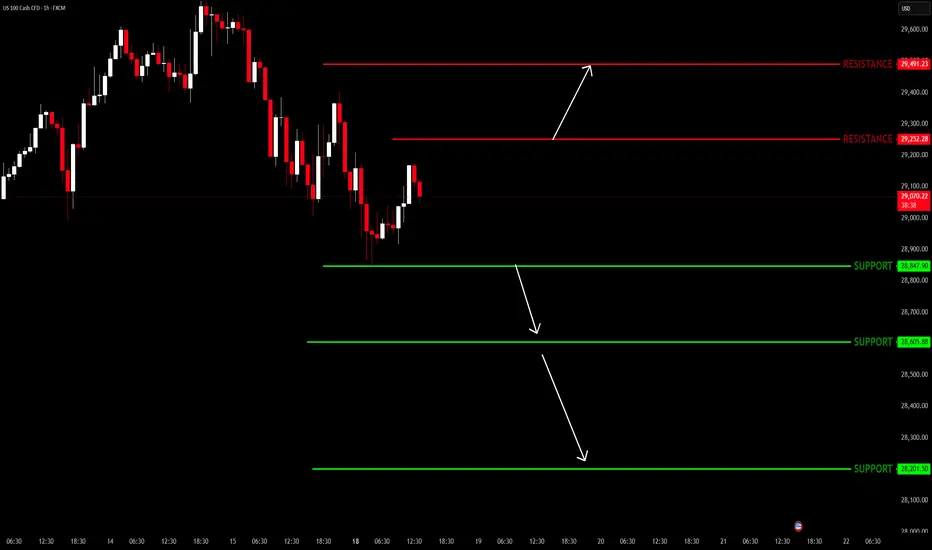
NAS100 is currently trading inside a defined range between resistance and support levels.
Resistance levels:
29,252.28
29,491.23
Support levels:
28,847.90
28,605.88
28,201.50
Current price is trading near 29,066.47, sitting between the first resistance and first support.
Bullish Scenario
If price breaks above 29,252.28 and a 1H candle closes above it, I expect continuation up to the next resistance at 29,491.23.
Entry: Above 29,252.28 after confirmation
Target: 29,491.23
Invalidation: Below 28,847.90
Bearish Scenario
If price breaks below 28,847.90 and a 1H candle closes below it, I expect a drop down to 28,605.88 first. After breaking below 28,605.88, the next support is 28,201.50.
Entry: Below 28,847.90 after confirmation
Target 1: 28,605.88
Target 2: 28,201.50
Invalidation: Above 29,252.28
Key Levels
Resistance: 29,252.28 / 29,491.23
Support: 28,847.90 / 28,605.88 / 28,201.50
Pro Tips from a real trader
Tip 1: Never enter at the exact level. Wait for a 1H candle close above resistance or below support first.
Tip 2: The 28,847.90 support is critical. If price closes below it with momentum, the short side becomes high probability.
Tip 3: If you miss the breakout, wait for a pullback. For longs, let price retest 29,252.28 as support. For shorts, let price retest 28,847.90 as resistance.
Tip 4: NAS100 is tech-heavy. It reacts strongly to Fed news, inflation data, and big tech earnings. Check the calendar before trading.
Tip 5: Always place your stop loss behind the next structure level. Do not risk more than 1-2 percent of your account.
Tip 6: False breaks are common on indices. Confirmation is everything.
My personal view
Price is currently sitting between 29,252.28 resistance and 28,847.90 support. I am waiting for a clean breakout in either direction. A close above 29,252.28 favors longs toward 29,491.23. A close below 28,847.90 favors shorts toward 28,605.88 and then 28,201.50. Patience is key. Let the market show its hand first.
Not financial advice. Trade at your own risk.
Tags: NAS100, Nasdaq, Indices, Breakout, PriceAction, TradingView, SupportAndResistance
Resistance levels:
29,252.28
29,491.23
Support levels:
28,847.90
28,605.88
28,201.50
Current price is trading near 29,066.47, sitting between the first resistance and first support.
Bullish Scenario
If price breaks above 29,252.28 and a 1H candle closes above it, I expect continuation up to the next resistance at 29,491.23.
Entry: Above 29,252.28 after confirmation
Target: 29,491.23
Invalidation: Below 28,847.90
Bearish Scenario
If price breaks below 28,847.90 and a 1H candle closes below it, I expect a drop down to 28,605.88 first. After breaking below 28,605.88, the next support is 28,201.50.
Entry: Below 28,847.90 after confirmation
Target 1: 28,605.88
Target 2: 28,201.50
Invalidation: Above 29,252.28
Key Levels
Resistance: 29,252.28 / 29,491.23
Support: 28,847.90 / 28,605.88 / 28,201.50
Pro Tips from a real trader
Tip 1: Never enter at the exact level. Wait for a 1H candle close above resistance or below support first.
Tip 2: The 28,847.90 support is critical. If price closes below it with momentum, the short side becomes high probability.
Tip 3: If you miss the breakout, wait for a pullback. For longs, let price retest 29,252.28 as support. For shorts, let price retest 28,847.90 as resistance.
Tip 4: NAS100 is tech-heavy. It reacts strongly to Fed news, inflation data, and big tech earnings. Check the calendar before trading.
Tip 5: Always place your stop loss behind the next structure level. Do not risk more than 1-2 percent of your account.
Tip 6: False breaks are common on indices. Confirmation is everything.
My personal view
Price is currently sitting between 29,252.28 resistance and 28,847.90 support. I am waiting for a clean breakout in either direction. A close above 29,252.28 favors longs toward 29,491.23. A close below 28,847.90 favors shorts toward 28,605.88 and then 28,201.50. Patience is key. Let the market show its hand first.
Not financial advice. Trade at your own risk.
Tags: NAS100, Nasdaq, Indices, Breakout, PriceAction, TradingView, SupportAndResistance
Trade chiuso: obiettivo raggiunto

Pubblicazioni correlate
Declinazione di responsabilità
Le informazioni e le pubblicazioni non sono intese come, e non costituiscono, consulenza o raccomandazioni finanziarie, di investimento, di trading o di altro tipo fornite o approvate da TradingView. Per ulteriori informazioni, consultare i Termini di utilizzo.
Pubblicazioni correlate
Declinazione di responsabilità
Le informazioni e le pubblicazioni non sono intese come, e non costituiscono, consulenza o raccomandazioni finanziarie, di investimento, di trading o di altro tipo fornite o approvate da TradingView. Per ulteriori informazioni, consultare i Termini di utilizzo.