
No financial market moves in a straight line despite the strength of sentiment. There will always be brief or extended pauses for reflection, profit taking and/or waiting for the outcome of a particular event, especially during a period of geopolitical crisis like the one currently being experienced in the Middle East.
It’s hard to deny that the recent price action in the US 100 during April has been anything other than impressive, trading from a low of 22774 registered on March 31st, up to a new all time high of 26736 on Friday, a gain of around 17.5% in just under 3 weeks. However, a ratcheting up of tensions between the US-Iran over the weekend, where Tehran closed the Strait of Hormuz on Saturday just 24 hours after reopening it, while the US Navy’s blockade of Iranian shipping continued and resulted in the seizing of a ship on Sunday, has thrown fresh doubt on whether the second round of peace talks between the two nations will happen before the existing 14 day ceasefire expires on Tuesday evening.
This news led traders to hit the pause button on the recent US 100 rally at the start of the new week, pushing the index down to a brief low of 26,400 before recovering to current levels around 25,520 at time of writing (0730 BST), as they await more information on whether peace talks happen and an extended ceasefire is potentially agreed, or if the situation escalates again which could damage risk sentiment and see a reduction of long positioning.
During these periods where a significant move has paused, it can be useful to use the time to reassess the technical outlook and identify potentially relevant levels that may come in to play as the week progresses.
Technical Update: Do New All-Time Highs Bring Fibonacci Extension Levels Into Play?
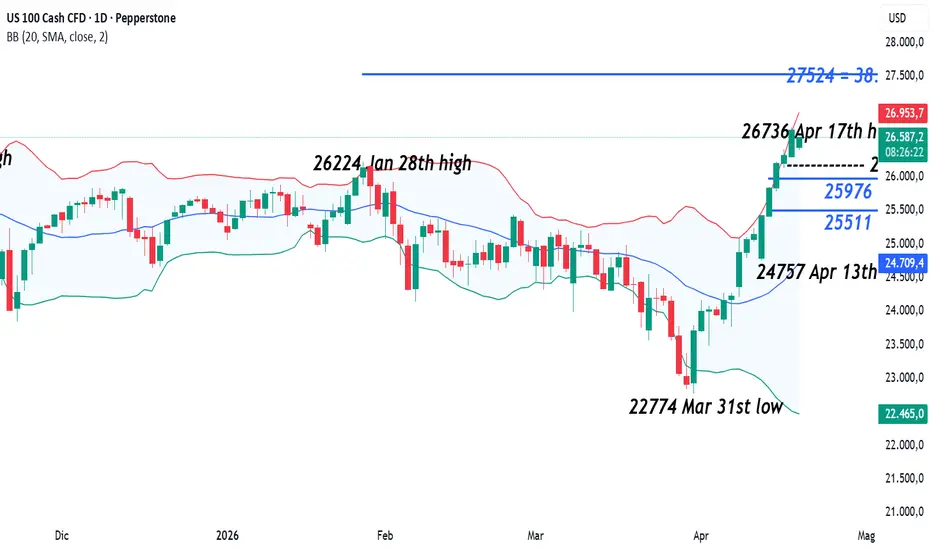
From the March 31st low (22774) to the April 17th high (26736) the US 100 index has rallied just under 17.5% in an almost uninterrupted period of price strength. Crucially, this advance has produced closing breaks above the old resistance band between 26224/26277, an area defined by the January 28th 2026 and October 30th 2025 highs, meaning 26736 now stands as a new all‑time high for the index.

Breaks to new all‑time highs or lows can often be challenging periods for traders, as uncertainty develops over whether the move can extend further in the direction of the break or whether, after a sustained price run, over‑extended conditions may increase the risk of a corrective move. As such, they could be searching out potential key support and resistance levels to monitor as the week progresses.
Potential Resistance Levels:
A previous all‑time high may often be a key resistance focus for traders, as sellers have emerged at this level before and succeeded in capping price strength, meaning they may be able to do so again. With that in mind, the latest all‑time high at 26736 could act as the first key resistance point, and how this level is defended on a closing basis may be worthwhile watching this week.
With any move to new all‑time highs, price action enters uncharted territory, making it more difficult to identify the next meaningful resistance levels. This is where Fibonacci extension levels can be useful in highlighting potential upside levels. Using the January 28th to March 31st sell‑off as the reference move, the 38.2% extension comes in at 27524. While a closing break above 26736 does not guarantee further price strength, it could shift focus toward 27524 as the next potential resistance level.
Potential Support Levels:
It has already been a sustained period of price strength, and it could be argued that over‑extended upside conditions are now in place. If so, prices may be exposed to the risk of a correction as a reaction to the latest advance. As the chart below shows, first key support might now stand at 26297, a level which is equal to Friday’s session low trade.
If price weakness is set to develop, it may well require closing breaks below 26297 to increase the probability of a deeper correction. Such a move could then open scope for further price weakness toward 25976, which is the 38.2% retracement of last week’s range, and if that level were also to give way, moves could even extend toward 25511, which is the deeper 61.8% retracement.
The material provided here has not been prepared accordance with legal requirements designed to promote the independence of investment research and as such is considered to be a marketing communication. Whilst it is not subject to any prohibition on dealing ahead of the dissemination of investment research, we will not seek to take any advantage before providing it to our clients.
Pepperstone doesn’t represent that the material provided here is accurate, current or complete, and therefore shouldn’t be relied upon as such. The information, whether from a third party or not, isn’t to be considered as a recommendation; or an offer to buy or sell; or the solicitation of an offer to buy or sell any security, financial product or instrument; or to participate in any particular trading strategy. It does not take into account readers’ financial situation or investment objectives. We advise any readers of this content to seek their own advice. Without the approval of Pepperstone, reproduction or redistribution of this information isn’t permitted.
It’s hard to deny that the recent price action in the US 100 during April has been anything other than impressive, trading from a low of 22774 registered on March 31st, up to a new all time high of 26736 on Friday, a gain of around 17.5% in just under 3 weeks. However, a ratcheting up of tensions between the US-Iran over the weekend, where Tehran closed the Strait of Hormuz on Saturday just 24 hours after reopening it, while the US Navy’s blockade of Iranian shipping continued and resulted in the seizing of a ship on Sunday, has thrown fresh doubt on whether the second round of peace talks between the two nations will happen before the existing 14 day ceasefire expires on Tuesday evening.
This news led traders to hit the pause button on the recent US 100 rally at the start of the new week, pushing the index down to a brief low of 26,400 before recovering to current levels around 25,520 at time of writing (0730 BST), as they await more information on whether peace talks happen and an extended ceasefire is potentially agreed, or if the situation escalates again which could damage risk sentiment and see a reduction of long positioning.
During these periods where a significant move has paused, it can be useful to use the time to reassess the technical outlook and identify potentially relevant levels that may come in to play as the week progresses.
Technical Update: Do New All-Time Highs Bring Fibonacci Extension Levels Into Play?
From the March 31st low (22774) to the April 17th high (26736) the US 100 index has rallied just under 17.5% in an almost uninterrupted period of price strength. Crucially, this advance has produced closing breaks above the old resistance band between 26224/26277, an area defined by the January 28th 2026 and October 30th 2025 highs, meaning 26736 now stands as a new all‑time high for the index.
Breaks to new all‑time highs or lows can often be challenging periods for traders, as uncertainty develops over whether the move can extend further in the direction of the break or whether, after a sustained price run, over‑extended conditions may increase the risk of a corrective move. As such, they could be searching out potential key support and resistance levels to monitor as the week progresses.
Potential Resistance Levels:
A previous all‑time high may often be a key resistance focus for traders, as sellers have emerged at this level before and succeeded in capping price strength, meaning they may be able to do so again. With that in mind, the latest all‑time high at 26736 could act as the first key resistance point, and how this level is defended on a closing basis may be worthwhile watching this week.
With any move to new all‑time highs, price action enters uncharted territory, making it more difficult to identify the next meaningful resistance levels. This is where Fibonacci extension levels can be useful in highlighting potential upside levels. Using the January 28th to March 31st sell‑off as the reference move, the 38.2% extension comes in at 27524. While a closing break above 26736 does not guarantee further price strength, it could shift focus toward 27524 as the next potential resistance level.
Potential Support Levels:
It has already been a sustained period of price strength, and it could be argued that over‑extended upside conditions are now in place. If so, prices may be exposed to the risk of a correction as a reaction to the latest advance. As the chart below shows, first key support might now stand at 26297, a level which is equal to Friday’s session low trade.
If price weakness is set to develop, it may well require closing breaks below 26297 to increase the probability of a deeper correction. Such a move could then open scope for further price weakness toward 25976, which is the 38.2% retracement of last week’s range, and if that level were also to give way, moves could even extend toward 25511, which is the deeper 61.8% retracement.
The material provided here has not been prepared accordance with legal requirements designed to promote the independence of investment research and as such is considered to be a marketing communication. Whilst it is not subject to any prohibition on dealing ahead of the dissemination of investment research, we will not seek to take any advantage before providing it to our clients.
Pepperstone doesn’t represent that the material provided here is accurate, current or complete, and therefore shouldn’t be relied upon as such. The information, whether from a third party or not, isn’t to be considered as a recommendation; or an offer to buy or sell; or the solicitation of an offer to buy or sell any security, financial product or instrument; or to participate in any particular trading strategy. It does not take into account readers’ financial situation or investment objectives. We advise any readers of this content to seek their own advice. Without the approval of Pepperstone, reproduction or redistribution of this information isn’t permitted.

Global risk Warning CFDs are complex instruments and come with a high risk of losing money rapidly due to leverage. Between 74-89% of retail investor accounts lose money when trading in CFDs. You should consider whether you understand how CFD
Declinazione di responsabilità
Le informazioni e le pubblicazioni non sono intese come, e non costituiscono, consulenza o raccomandazioni finanziarie, di investimento, di trading o di altro tipo fornite o approvate da TradingView. Per ulteriori informazioni, consultare i Termini di utilizzo.
Global risk Warning CFDs are complex instruments and come with a high risk of losing money rapidly due to leverage. Between 74-89% of retail investor accounts lose money when trading in CFDs. You should consider whether you understand how CFD
Declinazione di responsabilità
Le informazioni e le pubblicazioni non sono intese come, e non costituiscono, consulenza o raccomandazioni finanziarie, di investimento, di trading o di altro tipo fornite o approvate da TradingView. Per ulteriori informazioni, consultare i Termini di utilizzo.