
Market Structure
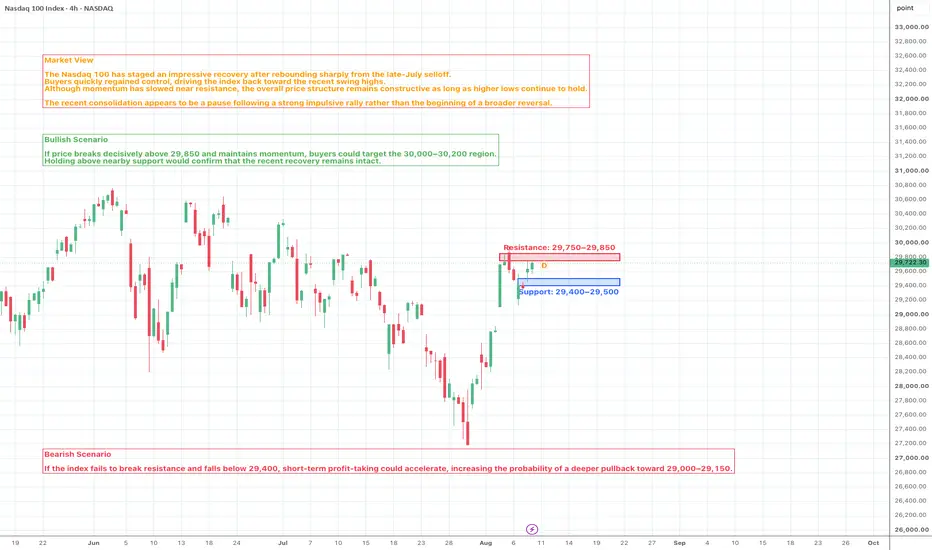
The 4-hour chart has shifted back to a bullish structure. The index has recovered from the recent correction and is now trading above previous support levels while building a series of higher lows.
Key Resistance
First Resistance: 29,750–29,850
This is the immediate resistance zone where recent buying momentum has started to slow.
Second Resistance: 30,000–30,200
A successful breakout above the current range could open the door for another leg higher toward this psychological resistance area.
Key Support
First Support: 29,400–29,500
This area represents the first support where buyers may attempt to defend the current uptrend.
Second Support: 29,000–29,150
A break below the first support could expose this demand zone, where stronger buying interest may emerge.
Market Sentiment
Market sentiment remains cautiously bullish.
The sharp recovery suggests buyers have regained confidence after the previous correction. However, with the price approaching resistance, traders will likely look for confirmation before chasing higher levels. As long as higher lows remain intact, the overall bias continues to favor the upside.
Please share your view below:
Do you think the Nasdaq 100 has enough momentum to break above 30,000? Or will resistance trigger another short-term pullback before the next rally?
More market structure and key level updates will be shared regularly.
The 4-hour chart has shifted back to a bullish structure. The index has recovered from the recent correction and is now trading above previous support levels while building a series of higher lows.
Key Resistance
First Resistance: 29,750–29,850
This is the immediate resistance zone where recent buying momentum has started to slow.
Second Resistance: 30,000–30,200
A successful breakout above the current range could open the door for another leg higher toward this psychological resistance area.
Key Support
First Support: 29,400–29,500
This area represents the first support where buyers may attempt to defend the current uptrend.
Second Support: 29,000–29,150
A break below the first support could expose this demand zone, where stronger buying interest may emerge.
Market Sentiment
Market sentiment remains cautiously bullish.
The sharp recovery suggests buyers have regained confidence after the previous correction. However, with the price approaching resistance, traders will likely look for confirmation before chasing higher levels. As long as higher lows remain intact, the overall bias continues to favor the upside.
Please share your view below:
Do you think the Nasdaq 100 has enough momentum to break above 30,000? Or will resistance trigger another short-term pullback before the next rally?
More market structure and key level updates will be shared regularly.

Pubblicazioni correlate
Declinazione di responsabilità
Le informazioni e le pubblicazioni non sono intese come, e non costituiscono, consulenza o raccomandazioni finanziarie, di investimento, di trading o di altro tipo fornite o approvate da TradingView. Per ulteriori informazioni, consultare i Termini di utilizzo.
Pubblicazioni correlate
Declinazione di responsabilità
Le informazioni e le pubblicazioni non sono intese come, e non costituiscono, consulenza o raccomandazioni finanziarie, di investimento, di trading o di altro tipo fornite o approvate da TradingView. Per ulteriori informazioni, consultare i Termini di utilizzo.