
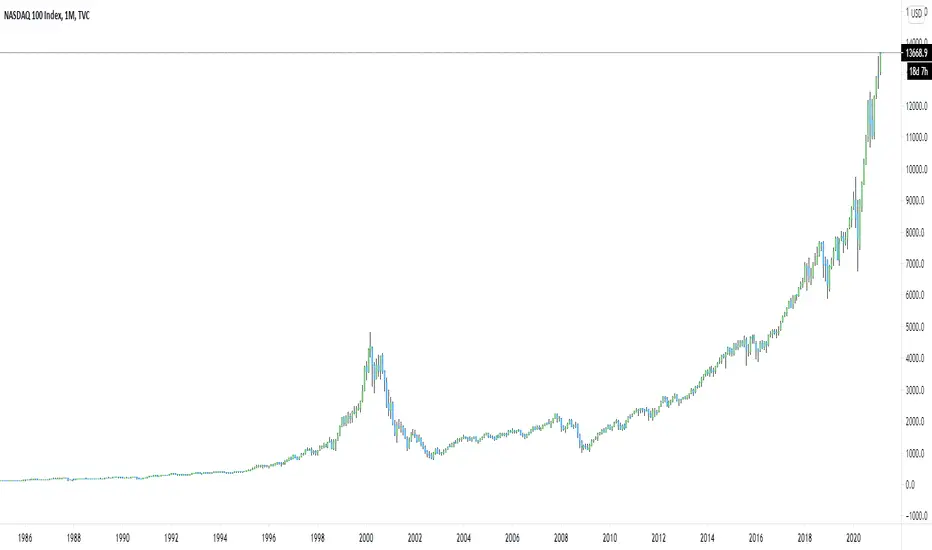
The NASDAQ Index from 1986 to present day monthly chart.
Here we can see the 2000 dot com bubble, the 2008 crash, the 2018 tremor, the coronavirus crash, and the 'to present' recovery and continuing bull run.
This is a monster swell! And when this wave finally breaks over, there's going to be a monster crash.
Here we can see the 2000 dot com bubble, the 2008 crash, the 2018 tremor, the coronavirus crash, and the 'to present' recovery and continuing bull run.
This is a monster swell! And when this wave finally breaks over, there's going to be a monster crash.
Nota
Will you be riding it down?
Declinazione di responsabilità
Le informazioni e le pubblicazioni non sono intese come, e non costituiscono, consulenza o raccomandazioni finanziarie, di investimento, di trading o di altro tipo fornite o approvate da TradingView. Per ulteriori informazioni, consultare i Termini di utilizzo.
Declinazione di responsabilità
Le informazioni e le pubblicazioni non sono intese come, e non costituiscono, consulenza o raccomandazioni finanziarie, di investimento, di trading o di altro tipo fornite o approvate da TradingView. Per ulteriori informazioni, consultare i Termini di utilizzo.