
Good morning my fellow Cryptocurrency trader, it is my pleasure to write again for you today.
I hope you are having a wonderful day, here it is a very nice morning and this chart looks great.
NEAR Protocol—NEARUSDT
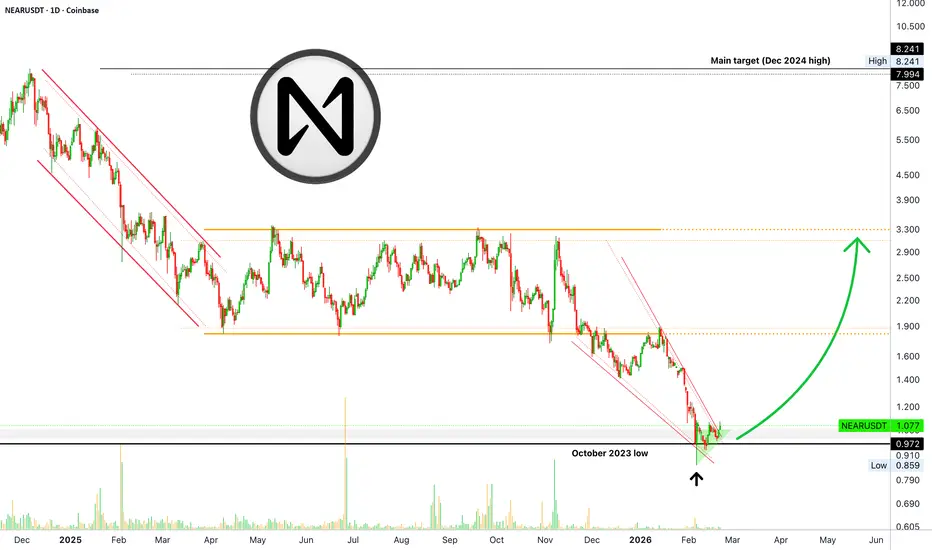
The black line represents a low-support from October 2023. This low point launched, started, initiated, propelled a 800%+ bullish wave. NEAR went below it recently but it is now back above. This recovery above long-term support you know gives us strong bullish connotations and denotation.
The support in question has already been tested, retested and recovered. NEARUSDT is already green when it comes to its potential. Below support would be very bad but even that we know would be only limited, ending, short-lived because the down-wave comes from up high, starting December 2024.
That's why we know once support is reached and challenged, even if it goes below support we stay bullish. Above support bullish and below support still bullish, waiting, expecting and anticipating a reversal. It is just the way it is with technical analysis.
I know you are with me because we've been together a long time, long-term, long duration; years and years on end. Certainly a nice ride and journey. I can continue to grow and learn thanks to your support. We are only getting started by the way.
The first target sits in the previous sideways trading range, on the upper end. We can say between $2.80-$3.00 without doing the numbers.
To me the end target sits around the December 2024 high based on some/many analyses we did in the recent past. This is a number range at $7.80 - $8.25. This project can be holden long-term as well.
The fact that the October 2023 last low was activated makes this a must have trading pair. The trading range from late 2023 wasn't the exact bottom as it is shown here. It was a range but higher and the level mapped on the chart was only the true low. So it is interesting and makes this setup that much stronger. It is the same bottom accumulation, consolidation zone.
It is the same but being activated after more than two years and action is happening here now; coupled with marketwide action and Bitcoin staying strong, rising, looking better and pointing higher, gives us more reason to buy and hold.
Thank you. I intend to continue to share more.
Namaste.
I hope you are having a wonderful day, here it is a very nice morning and this chart looks great.
NEAR Protocol—NEARUSDT
The black line represents a low-support from October 2023. This low point launched, started, initiated, propelled a 800%+ bullish wave. NEAR went below it recently but it is now back above. This recovery above long-term support you know gives us strong bullish connotations and denotation.
The support in question has already been tested, retested and recovered. NEARUSDT is already green when it comes to its potential. Below support would be very bad but even that we know would be only limited, ending, short-lived because the down-wave comes from up high, starting December 2024.
That's why we know once support is reached and challenged, even if it goes below support we stay bullish. Above support bullish and below support still bullish, waiting, expecting and anticipating a reversal. It is just the way it is with technical analysis.
I know you are with me because we've been together a long time, long-term, long duration; years and years on end. Certainly a nice ride and journey. I can continue to grow and learn thanks to your support. We are only getting started by the way.
The first target sits in the previous sideways trading range, on the upper end. We can say between $2.80-$3.00 without doing the numbers.
To me the end target sits around the December 2024 high based on some/many analyses we did in the recent past. This is a number range at $7.80 - $8.25. This project can be holden long-term as well.
The fact that the October 2023 last low was activated makes this a must have trading pair. The trading range from late 2023 wasn't the exact bottom as it is shown here. It was a range but higher and the level mapped on the chart was only the true low. So it is interesting and makes this setup that much stronger. It is the same bottom accumulation, consolidation zone.
It is the same but being activated after more than two years and action is happening here now; coupled with marketwide action and Bitcoin staying strong, rising, looking better and pointing higher, gives us more reason to buy and hold.
Thank you. I intend to continue to share more.
Namaste.
Trade attivo
The first target range is about to become activated, $2.80-$3.00. There are higher targets for this same market phase. Read the description above for more details, but we can expect massive growth in short.So far, more than 130% profits. It seems like we get much more in the coming months. Watch out for retraces and corrections, these are a normal part of the bullish cycle.
Namaste.
Nota
$3.00 has already been hit. And we go higher.
Trading Cryptocurrencies can be the hardest undertaking ever without the right trade-numbers, without accurate private-access information. Free is free, but the best always requires sweat, an investment. Since 2017 👇
t.me/masteranandatrades/8778
t.me/masteranandatrades/8778
Pubblicazioni correlate
Declinazione di responsabilità
Le informazioni e le pubblicazioni non sono intese come, e non costituiscono, consulenza o raccomandazioni finanziarie, di investimento, di trading o di altro tipo fornite o approvate da TradingView. Per ulteriori informazioni, consultare i Termini di utilizzo.
Trading Cryptocurrencies can be the hardest undertaking ever without the right trade-numbers, without accurate private-access information. Free is free, but the best always requires sweat, an investment. Since 2017 👇
t.me/masteranandatrades/8778
t.me/masteranandatrades/8778
Pubblicazioni correlate
Declinazione di responsabilità
Le informazioni e le pubblicazioni non sono intese come, e non costituiscono, consulenza o raccomandazioni finanziarie, di investimento, di trading o di altro tipo fornite o approvate da TradingView. Per ulteriori informazioni, consultare i Termini di utilizzo.