NEO - nice chart
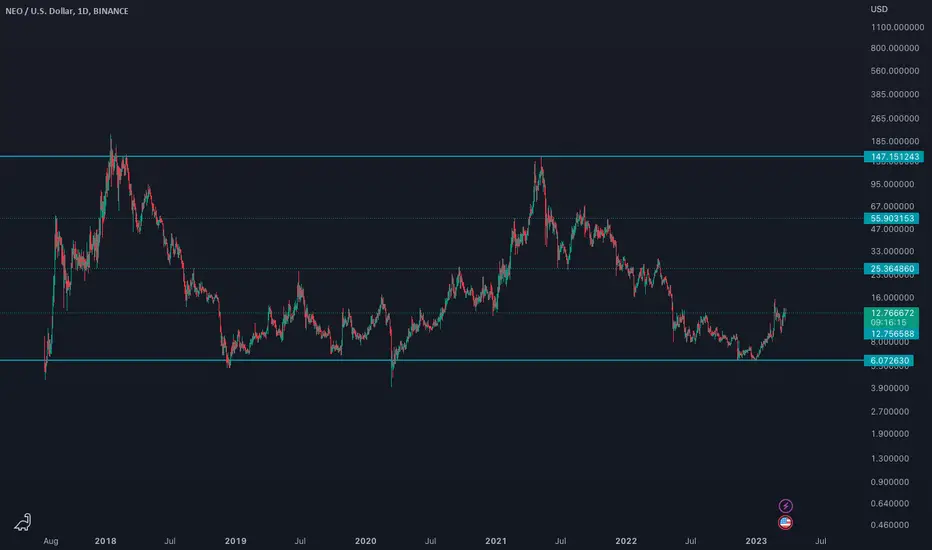
The NEO chart, very nice how it moved in 5 years between a very strong support and resistance and 3 other lines that were alternately when support, when resistance. Of course, on the 1D timeframe. What will NEO do next? We follow his evolution. Now everything seems simpler and it seems easier to identify a bottom or a top.

Declinazione di responsabilità
Le informazioni e le pubblicazioni non sono intese come, e non costituiscono, consulenza o raccomandazioni finanziarie, di investimento, di trading o di altro tipo fornite o approvate da TradingView. Per ulteriori informazioni, consultare i Termini di utilizzo.
Declinazione di responsabilità
Le informazioni e le pubblicazioni non sono intese come, e non costituiscono, consulenza o raccomandazioni finanziarie, di investimento, di trading o di altro tipo fornite o approvate da TradingView. Per ulteriori informazioni, consultare i Termini di utilizzo.