Long
NEW - Trade Plan
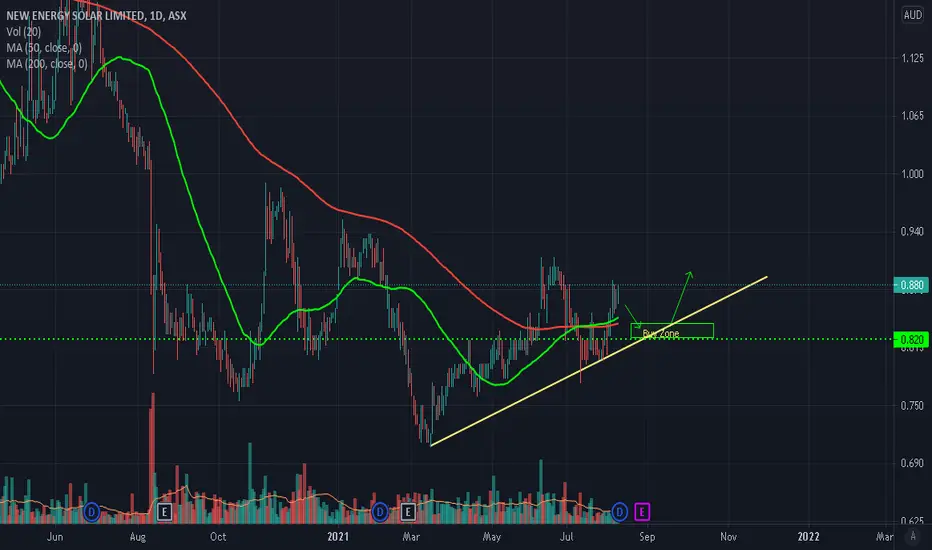
NEW is looking good on the Weekly and Monthly Chart and indicating that the long term downtrend may be over or the downward momentum may be shifting to the long side and it wants to move higher. I have a Buy Zone between $0.820 - $0.840 (previous Resistance level - now Support), where I expect price to retest. I will look for bullish price action confirmation to get long and would look to ride the swing.
Please note these are my own notes, by no means trading advice. Please do your own research before entering into any trade.
Please note these are my own notes, by no means trading advice. Please do your own research before entering into any trade.
Nota
Nota
As mentioned earlier, it is showing Bullish price action on the weekly and monthly charts and high volume.
Declinazione di responsabilità
Le informazioni e le pubblicazioni non sono intese come, e non costituiscono, consulenza o raccomandazioni finanziarie, di investimento, di trading o di altro tipo fornite o approvate da TradingView. Per ulteriori informazioni, consultare i Termini di utilizzo.
Declinazione di responsabilità
Le informazioni e le pubblicazioni non sono intese come, e non costituiscono, consulenza o raccomandazioni finanziarie, di investimento, di trading o di altro tipo fornite o approvate da TradingView. Per ulteriori informazioni, consultare i Termini di utilizzo.