
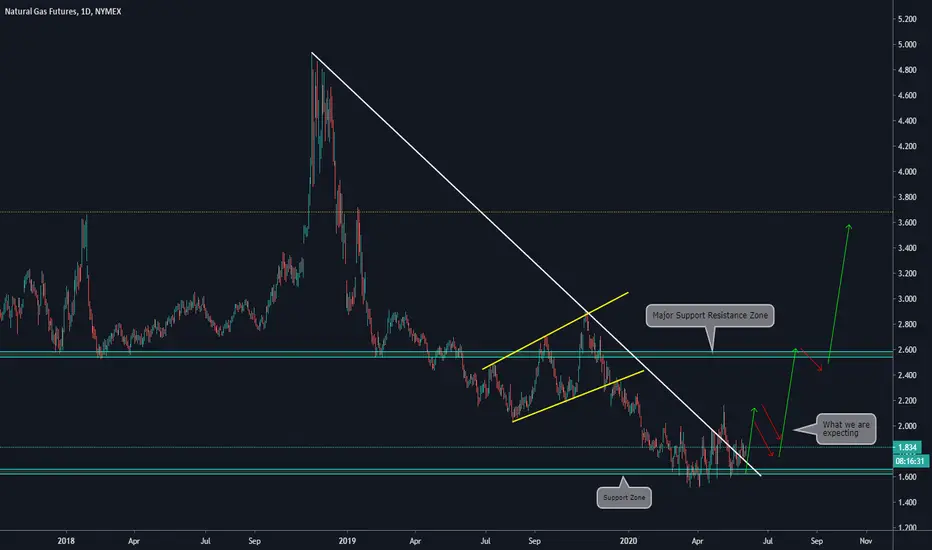
Main items we can see on the chart:
a) The price is on a well-tested support zone
b) The price has broken the descending trendline
c) We want to see a clear impulse outside the previous descending trendline + a 10-12 days correction
d) The reason we have decided that filter is because we observed similar behavior on the Weekly Chart in previous situations
WEEKLY CHART:

a) The price is on a well-tested support zone
b) The price has broken the descending trendline
c) We want to see a clear impulse outside the previous descending trendline + a 10-12 days correction
d) The reason we have decided that filter is because we observed similar behavior on the Weekly Chart in previous situations
WEEKLY CHART:

Pubblicazioni correlate
Declinazione di responsabilità
Le informazioni e le pubblicazioni non sono intese come, e non costituiscono, consulenza o raccomandazioni finanziarie, di investimento, di trading o di altro tipo fornite o approvate da TradingView. Per ulteriori informazioni, consultare i Termini di utilizzo.
Pubblicazioni correlate
Declinazione di responsabilità
Le informazioni e le pubblicazioni non sono intese come, e non costituiscono, consulenza o raccomandazioni finanziarie, di investimento, di trading o di altro tipo fornite o approvate da TradingView. Per ulteriori informazioni, consultare i Termini di utilizzo.