
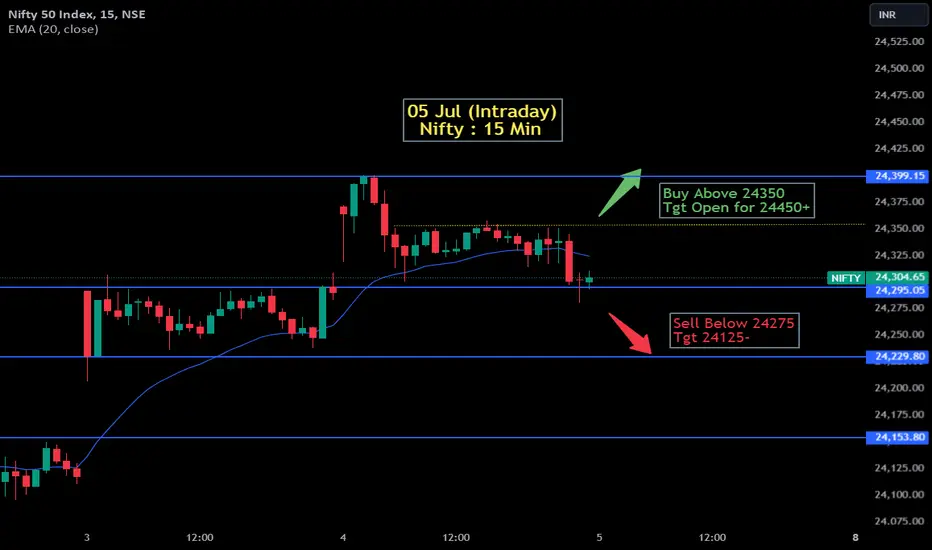
The image is a chart displaying the 15-minute price movements of the Nifty 50 Index for July 3rd and 4th, 2024. It includes technical analysis with marked buy and sell signals:
-Buy Signal: A suggestion to buy above 24,350 with a target open for 24,450 or more.
-Sell Signal: A recommendation to sell below 24,275 with a target of 24,125 or lower.
The chart also shows the 20-period Exponential Moving Average (EMA), which helps traders gauge the trend direction and potential support or resistance levels.
-Buy Signal: A suggestion to buy above 24,350 with a target open for 24,450 or more.
-Sell Signal: A recommendation to sell below 24,275 with a target of 24,125 or lower.
The chart also shows the 20-period Exponential Moving Average (EMA), which helps traders gauge the trend direction and potential support or resistance levels.

Declinazione di responsabilità
Le informazioni e le pubblicazioni non sono intese come, e non costituiscono, consulenza o raccomandazioni finanziarie, di investimento, di trading o di altro tipo fornite o approvate da TradingView. Per ulteriori informazioni, consultare i Termini di utilizzo.
Declinazione di responsabilità
Le informazioni e le pubblicazioni non sono intese come, e non costituiscono, consulenza o raccomandazioni finanziarie, di investimento, di trading o di altro tipo fornite o approvate da TradingView. Per ulteriori informazioni, consultare i Termini di utilizzo.