
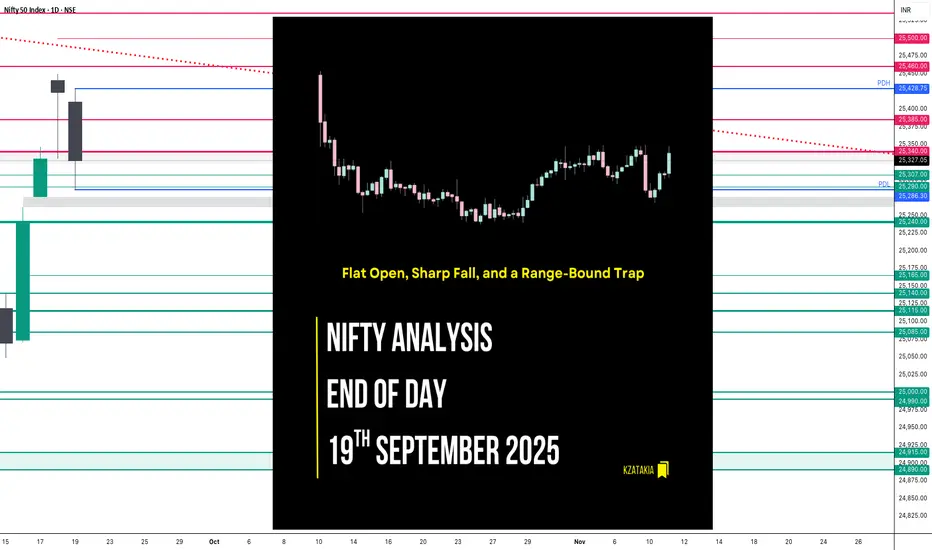
🟢 Nifty Analysis EOD – September 19, 2025 – Friday 🔴
Flat Open, Sharp Fall, and a Range-Bound Trap
🗞 Nifty Summary
Gift Nifty hinted at a 50-point gap down, but Nifty opened nearly flat at 25,410. However, the bulls couldn’t hold, and within the first 45 minutes, the index slipped 132 points, breaking S1 and PDL to mark the day’s low at 25,297.
The rest of the day was stuck in a narrow 50-point band, with both sides witnessing fakeouts. The index finally closed exactly at S1 (25,352.5), about 66 points above the low.
The total range for the day stood at 142 points, and closing below previous day low showing weakness after yesterday’s sharp recovery attempt.
Yesterday’s note highlighted:
“The 100-point recovery was unexpected.”
— Today, that very recovery got completely wiped out in the early part of the session.
🗞 Last 3 Sessions breakdown
17th Sep 2025 → Open: 25,276.60 | Close: 25,330.25 | Change: +91.15 (+0.36%) → Bullish, small green candle
18th Sep 2025 → Open: 25,441.05 | Close: 25,423.60 | Change: +93.35 (+0.37%) → Bullish continuation, narrow range
19th Sep 2025 → Open: 25,410.20 | Close: 25,327.05 | Change: −96.55 (−0.38%) → Bearish, closes near 17th close
📌 Pattern Check:
The 3-session structure shows some similarity (~65%) with an Evening Star, but not a textbook one:
1st candle = Bullish
2nd candle = Strong bullish continuation (not a small-bodied star)
3rd candle = Bearish close near/below 17th session’s midpoint
👉 Interpretation:
This looks like a weak Evening Star variation, hinting at possible reversal.
For trading perspective, it’s more of a caution signal than a short trigger — confirmation from the next session’s candle is essential.
🛡 5 Min Intraday Chart with Levels

📉 Daily Time Frame Chart with Intraday Levels

🕯 Daily Candle Breakdown
Open: 25,410.20
High: 25,428.75
Low: 25,286.30
Close: 25,327.05
Change: −96.55 (−0.38%)
🏗️ Structure Breakdown
Red candle (Close < Open).
Body: ~83.15 points (moderate).
Upper wick: ~18.55 points.
Lower wick: ~40.75 points.
Closed closer to the low → Selling pressure throughout the session.
📚 Interpretation
Market opened flat but faced resistance near 25,428 (close to yesterday’s high).
Selling dragged it to 25,286, with only a mild recovery into the close.
Indicates a supply zone around 25,420–25,450.
🕯Candle Type
Bearish candle with a small lower wick.
Not a reversal by itself, but signals loss of momentum after prior strength.
📉📈 Short-Term View – September 22, 2025
Resistance: 25,420–25,450 remains strong.
Support: 25,285–25,300 (today’s low).
Breakdown below 25,240 → Downside may stretch to 25,200–25,140.
Bulls need to reclaim 25,400+ quickly to keep the uptrend alive.
🛡 5 Min Intraday Chart

⚔️ Gladiator Strategy Update
ATR: 159.12
IB Range: 114.45 → Wide
Market Structure: balanced
Trade Highlights:
11:45 Short Trade → SL Hit
📌 Support & Resistance Levels
Resistance Zones:
25,340 ~ 25,385
25,425 ~ 25,460
25,500 (Psychological Level)
25,535
Support Zones:
25,307
25,290
25,275 ~ 25,260
25,240
💡 Final Thoughts
The market delivered a sharp fall early, followed by a dull range-bound trap. The weak Evening Star variation hints that momentum is fading.
👉 Bulls must reclaim 25,400+, else a drift toward 25,200 cannot be ruled out.
📖 “Markets often whisper before they shout — today was one such whisper of caution.”
✏️ Disclaimer
This is just my personal viewpoint. Always consult your financial advisor before taking any action.
Flat Open, Sharp Fall, and a Range-Bound Trap
🗞 Nifty Summary
Gift Nifty hinted at a 50-point gap down, but Nifty opened nearly flat at 25,410. However, the bulls couldn’t hold, and within the first 45 minutes, the index slipped 132 points, breaking S1 and PDL to mark the day’s low at 25,297.
The rest of the day was stuck in a narrow 50-point band, with both sides witnessing fakeouts. The index finally closed exactly at S1 (25,352.5), about 66 points above the low.
The total range for the day stood at 142 points, and closing below previous day low showing weakness after yesterday’s sharp recovery attempt.
Yesterday’s note highlighted:
“The 100-point recovery was unexpected.”
— Today, that very recovery got completely wiped out in the early part of the session.
🗞 Last 3 Sessions breakdown
17th Sep 2025 → Open: 25,276.60 | Close: 25,330.25 | Change: +91.15 (+0.36%) → Bullish, small green candle
18th Sep 2025 → Open: 25,441.05 | Close: 25,423.60 | Change: +93.35 (+0.37%) → Bullish continuation, narrow range
19th Sep 2025 → Open: 25,410.20 | Close: 25,327.05 | Change: −96.55 (−0.38%) → Bearish, closes near 17th close
📌 Pattern Check:
The 3-session structure shows some similarity (~65%) with an Evening Star, but not a textbook one:
1st candle = Bullish
2nd candle = Strong bullish continuation (not a small-bodied star)
3rd candle = Bearish close near/below 17th session’s midpoint
👉 Interpretation:
This looks like a weak Evening Star variation, hinting at possible reversal.
For trading perspective, it’s more of a caution signal than a short trigger — confirmation from the next session’s candle is essential.
🛡 5 Min Intraday Chart with Levels
📉 Daily Time Frame Chart with Intraday Levels
🕯 Daily Candle Breakdown
Open: 25,410.20
High: 25,428.75
Low: 25,286.30
Close: 25,327.05
Change: −96.55 (−0.38%)
🏗️ Structure Breakdown
Red candle (Close < Open).
Body: ~83.15 points (moderate).
Upper wick: ~18.55 points.
Lower wick: ~40.75 points.
Closed closer to the low → Selling pressure throughout the session.
📚 Interpretation
Market opened flat but faced resistance near 25,428 (close to yesterday’s high).
Selling dragged it to 25,286, with only a mild recovery into the close.
Indicates a supply zone around 25,420–25,450.
🕯Candle Type
Bearish candle with a small lower wick.
Not a reversal by itself, but signals loss of momentum after prior strength.
📉📈 Short-Term View – September 22, 2025
Resistance: 25,420–25,450 remains strong.
Support: 25,285–25,300 (today’s low).
Breakdown below 25,240 → Downside may stretch to 25,200–25,140.
Bulls need to reclaim 25,400+ quickly to keep the uptrend alive.
🛡 5 Min Intraday Chart
⚔️ Gladiator Strategy Update
ATR: 159.12
IB Range: 114.45 → Wide
Market Structure: balanced
Trade Highlights:
11:45 Short Trade → SL Hit
📌 Support & Resistance Levels
Resistance Zones:
25,340 ~ 25,385
25,425 ~ 25,460
25,500 (Psychological Level)
25,535
Support Zones:
25,307
25,290
25,275 ~ 25,260
25,240
💡 Final Thoughts
The market delivered a sharp fall early, followed by a dull range-bound trap. The weak Evening Star variation hints that momentum is fading.
👉 Bulls must reclaim 25,400+, else a drift toward 25,200 cannot be ruled out.
📖 “Markets often whisper before they shout — today was one such whisper of caution.”
✏️ Disclaimer
This is just my personal viewpoint. Always consult your financial advisor before taking any action.

Read my blogs here:
substack.com/@kzatakia
Follow me on Telegram:
t.me/swingtraderhub
Follow me on X:
x.com/kzatakia
substack.com/@kzatakia
Follow me on Telegram:
t.me/swingtraderhub
Follow me on X:
x.com/kzatakia
Pubblicazioni correlate
Declinazione di responsabilità
Le informazioni e le pubblicazioni non sono intese come, e non costituiscono, consulenza o raccomandazioni finanziarie, di investimento, di trading o di altro tipo fornite o approvate da TradingView. Per ulteriori informazioni, consultare i Termini di utilizzo.
Read my blogs here:
substack.com/@kzatakia
Follow me on Telegram:
t.me/swingtraderhub
Follow me on X:
x.com/kzatakia
substack.com/@kzatakia
Follow me on Telegram:
t.me/swingtraderhub
Follow me on X:
x.com/kzatakia
Pubblicazioni correlate
Declinazione di responsabilità
Le informazioni e le pubblicazioni non sono intese come, e non costituiscono, consulenza o raccomandazioni finanziarie, di investimento, di trading o di altro tipo fornite o approvate da TradingView. Per ulteriori informazioni, consultare i Termini di utilizzo.