
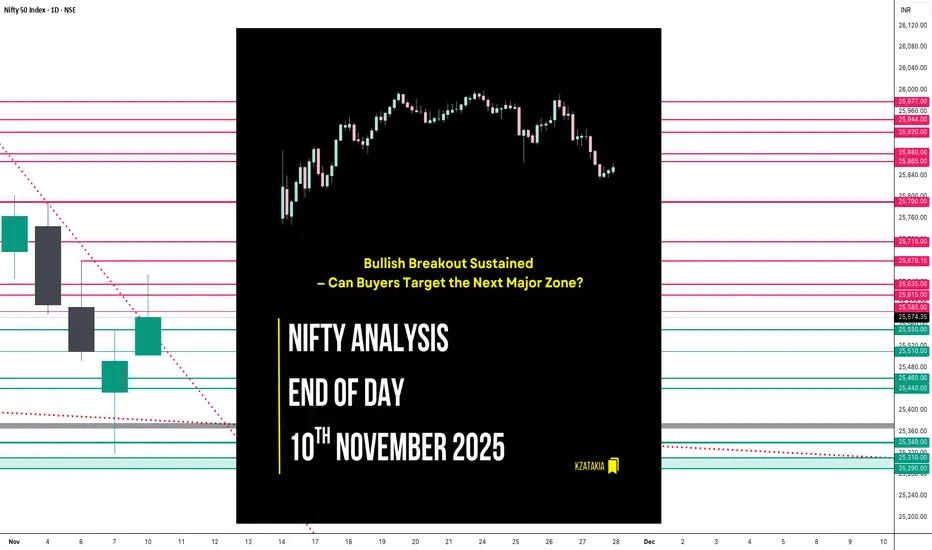
🟢 Nifty Analysis EOD – November 10, 2025 – Monday 🔴
Bullish Breakout Sustained — Can Buyers Target the Next Major Zone?
🗞 Nifty Summary
Nifty continued its recovery, successfully breaching and closing above the previous day’s high (PDH), signaling strong follow-through. Despite giving up half of the day’s gains in a volatile final hour, the index settled at 25574.25, confirming that bulls remain in control of the short-term sentiment.
This session effectively formed an Open=Low (OL) structure (ignoring a minor 6-point shadow), reflecting strong conviction from the open. To maintain this bullish momentum, bulls must decisively close above 25650 and aim for 25790. Should momentum falter, holding the 25400 level is critical for survival in the current structural battle.
🛡 Intraday Walk
The session commenced with a flat to positive bias, immediately spiking 70 points within the first minute to breach the PDH and R1, marking an initial day high at 25591.45. This initial surge could not be held, leading to a brief slip back toward the session’s opening level.
From there, a strong and gradual ascent began, successfully clearing the PDH, R1, and CDH. Nifty then crossed the Important Resistance Zone of 25615 ~ 25635, establishing a new intraday peak at 25651.95.
After marking this high, Nifty entered a tight consolidation phase for the next 2 hours and 15 minutes, ranging narrowly between 25652 ~ 25620. This equilibrium was shattered at 13:40, triggering a breakdown and a surge in volatility. A sharp, sudden fall and immediate recovery from the mean level likely trapped many short-term traders.
A final attempt to breach the day high failed, and bears took charge, dragging the index down by around 87 points, pushing it below the mean and IB High. Ultimately, Nifty surrendered half of its morning gain, but closed convincingly at 25574.25, above the previous day’s high.
🛡 5 Min Intraday Chart with Levels

📉 Daily Time Frame Chart with Intraday Levels

🕯 Daily Candle Breakdown
Open: 25,503.50
High: 25,653.45
Low: 25,503.50
Close: 25,574.35
Change: +82.05 (+0.32%)
🏗️ Structure Breakdown
Type: Bullish candle with a relatively narrow body but clean structure.
Range (High–Low): ≈ 149.95 points — a modest intraday movement.
Body: ≈ 70.85 points — reflective of a steady upward close.
Lower Wick: No lower wick → buying strength evident from the very start of the session (Open = Low).
Upper Wick: Small upper wick → mild profit booking near the top, but buyers held control until the close.
📚 Interpretation
The day opened precisely at the session’s low, signaling that sellers had zero conviction from the start. Prices sustained gains throughout the session, closing well above the midpoint of the range. This structure indicates controlled, steady buying throughout the majority of the day—a powerful sign of returning confidence and structural strength following last Friday’s reversal.
🕯 Candle Type
This session formed a Bullish Marubozu variant (Open = Low, strong close). It reflects decisive bullish sentiment, often acting as a continuation signal or early confirmation after a period of consolidation.
🛡 5 Min Intraday Chart

⚔️ Gladiator Strategy Update
ATR: 199.99
IB Range: 80.45 → Medium
Market Structure: ImBalanced
Trade Highlights:
09:35 Long Trade – Target Achieved (R:R 1:2.38)
13:05 Short Trade - Target Achieved (R:R 1:3.14)
Trade Summary: The Gladiator Strategy successfully captured the initial bullish momentum and later capitalised on the profit-booking phase, securing two high-R:R exits.
🧱 Support & Resistance Levels
Resistance Zones:
25585
25615 ~ 25635
25680
25715
25790
Support Zones:
25550
25510
25460 ~ 25440
🧠 Final Thoughts
“When the market opens at the low and stays there, you are looking at commitment, not doubt.”
Today’s Open=Low structure was a clear continuation signal, teaching us that conviction often trumps recent volatility. The primary lesson is that while consolidation (like the midday range) can be boring, the breakout (or breakdown) that follows is where the most powerful trades are found. For motivation, remember that even a strong bullish day offers tactical counter-trend opportunities, as proven by the successful late-day short trade.
✏️ Disclaimer
This is just my personal viewpoint. Always consult your financial advisor before taking any action.
Bullish Breakout Sustained — Can Buyers Target the Next Major Zone?
🗞 Nifty Summary
Nifty continued its recovery, successfully breaching and closing above the previous day’s high (PDH), signaling strong follow-through. Despite giving up half of the day’s gains in a volatile final hour, the index settled at 25574.25, confirming that bulls remain in control of the short-term sentiment.
This session effectively formed an Open=Low (OL) structure (ignoring a minor 6-point shadow), reflecting strong conviction from the open. To maintain this bullish momentum, bulls must decisively close above 25650 and aim for 25790. Should momentum falter, holding the 25400 level is critical for survival in the current structural battle.
🛡 Intraday Walk
The session commenced with a flat to positive bias, immediately spiking 70 points within the first minute to breach the PDH and R1, marking an initial day high at 25591.45. This initial surge could not be held, leading to a brief slip back toward the session’s opening level.
From there, a strong and gradual ascent began, successfully clearing the PDH, R1, and CDH. Nifty then crossed the Important Resistance Zone of 25615 ~ 25635, establishing a new intraday peak at 25651.95.
After marking this high, Nifty entered a tight consolidation phase for the next 2 hours and 15 minutes, ranging narrowly between 25652 ~ 25620. This equilibrium was shattered at 13:40, triggering a breakdown and a surge in volatility. A sharp, sudden fall and immediate recovery from the mean level likely trapped many short-term traders.
A final attempt to breach the day high failed, and bears took charge, dragging the index down by around 87 points, pushing it below the mean and IB High. Ultimately, Nifty surrendered half of its morning gain, but closed convincingly at 25574.25, above the previous day’s high.
🛡 5 Min Intraday Chart with Levels
📉 Daily Time Frame Chart with Intraday Levels
🕯 Daily Candle Breakdown
Open: 25,503.50
High: 25,653.45
Low: 25,503.50
Close: 25,574.35
Change: +82.05 (+0.32%)
🏗️ Structure Breakdown
Type: Bullish candle with a relatively narrow body but clean structure.
Range (High–Low): ≈ 149.95 points — a modest intraday movement.
Body: ≈ 70.85 points — reflective of a steady upward close.
Lower Wick: No lower wick → buying strength evident from the very start of the session (Open = Low).
Upper Wick: Small upper wick → mild profit booking near the top, but buyers held control until the close.
📚 Interpretation
The day opened precisely at the session’s low, signaling that sellers had zero conviction from the start. Prices sustained gains throughout the session, closing well above the midpoint of the range. This structure indicates controlled, steady buying throughout the majority of the day—a powerful sign of returning confidence and structural strength following last Friday’s reversal.
🕯 Candle Type
This session formed a Bullish Marubozu variant (Open = Low, strong close). It reflects decisive bullish sentiment, often acting as a continuation signal or early confirmation after a period of consolidation.
🛡 5 Min Intraday Chart
⚔️ Gladiator Strategy Update
ATR: 199.99
IB Range: 80.45 → Medium
Market Structure: ImBalanced
Trade Highlights:
09:35 Long Trade – Target Achieved (R:R 1:2.38)
13:05 Short Trade - Target Achieved (R:R 1:3.14)
Trade Summary: The Gladiator Strategy successfully captured the initial bullish momentum and later capitalised on the profit-booking phase, securing two high-R:R exits.
🧱 Support & Resistance Levels
Resistance Zones:
25585
25615 ~ 25635
25680
25715
25790
Support Zones:
25550
25510
25460 ~ 25440
🧠 Final Thoughts
“When the market opens at the low and stays there, you are looking at commitment, not doubt.”
Today’s Open=Low structure was a clear continuation signal, teaching us that conviction often trumps recent volatility. The primary lesson is that while consolidation (like the midday range) can be boring, the breakout (or breakdown) that follows is where the most powerful trades are found. For motivation, remember that even a strong bullish day offers tactical counter-trend opportunities, as proven by the successful late-day short trade.
✏️ Disclaimer
This is just my personal viewpoint. Always consult your financial advisor before taking any action.

Read my blogs here:
substack.com/@kzatakia
Follow me on Telegram:
t.me/swingtraderhub
Follow me on X:
x.com/kzatakia
substack.com/@kzatakia
Follow me on Telegram:
t.me/swingtraderhub
Follow me on X:
x.com/kzatakia
Pubblicazioni correlate
Declinazione di responsabilità
Le informazioni e le pubblicazioni non sono intese come, e non costituiscono, consulenza o raccomandazioni finanziarie, di investimento, di trading o di altro tipo fornite o approvate da TradingView. Per ulteriori informazioni, consultare i Termini di utilizzo.
Read my blogs here:
substack.com/@kzatakia
Follow me on Telegram:
t.me/swingtraderhub
Follow me on X:
x.com/kzatakia
substack.com/@kzatakia
Follow me on Telegram:
t.me/swingtraderhub
Follow me on X:
x.com/kzatakia
Pubblicazioni correlate
Declinazione di responsabilità
Le informazioni e le pubblicazioni non sono intese come, e non costituiscono, consulenza o raccomandazioni finanziarie, di investimento, di trading o di altro tipo fornite o approvate da TradingView. Per ulteriori informazioni, consultare i Termini di utilizzo.