
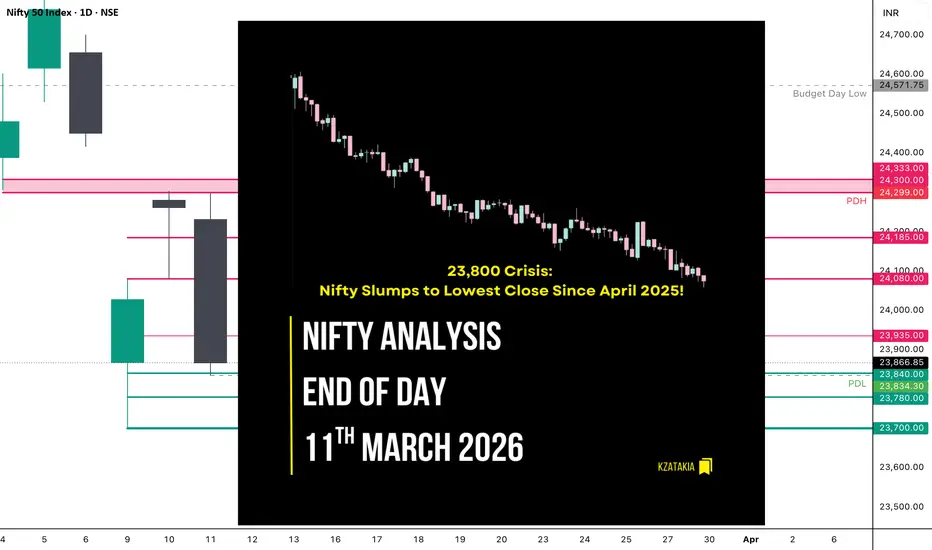
🟢 Nifty Analysis EOD – March 11, 2026 – Wednesday 🔴
23,800 Crisis: Nifty Slumps to Lowest Close Since April 2025!
🗞 Nifty Summary
The Nifty started the session with a minor 22-point Gap Down, but any hopes for a recovery were dashed almost immediately.
Following a flat opening tick, the index made a feeble attempt to test the 24,300 ~ 24,330 resistance zone mentioned in yesterday’s diary.
After a sharp rejection from this level, Nifty entered a “slow yet brutal” downward spiral. It rolled down without respecting any support levels, with pullbacks limited to a mere 50-60 points—never enough to threaten the bears’ control.
The index eventually closed near the absolute bottom of the day at 23,848.20 (Adjusted close: 23,866.85), losing -394.75 points (-1.63%).
Today’s session was a masterclass in persistent selling pressure. By finishing at these levels, Nifty has recorded its lowest close since April 21, 2025.
We are now sitting on the edge of the 23,800 critical floor. If this level fails to hold on a closing basis in the coming sessions, the structural damage could extend the fall toward the 23,200 level.
🛡 5 Min Intraday Chart with Levels

📉 Daily Time Frame Chart with Intraday Levels

🕯 Daily Candle Breakdown
Open: 24,231.85
High: 24,299.00
Low: 23,834.30
Close: 23,866.85
Change: -394.75 (-1.63%)
🏗️ Structure Breakdown
Type: Strong Bearish Candle (Full Body).
Range: ≈ 465 points — Extremely high volatility.
Body: ≈ 365 points — Reflects aggressive and dominant selling pressure.
Upper Wick: ≈ 67 points — Failed attempt to reclaim the 24,300 resistance.
Lower Wick: ≈ 32 points — Very limited buying interest near the day’s lows.
🛡 5 Min Intraday Chart

⚔️ Gladiator Strategy Update
ATR: 384.25
IB Range: 154.35 → Medium
Market Structure: Balanced (Initially) → Imbalance
Trade Highlights:
No Trade
Trade Summary: I was not available at my desk today, and my personal rules strictly forbid remote trading via mobile or other devices. While the market provided a clear directional move, staying disciplined to my rules is more important than catching a move. Sometimes the best trade is the one you don’t take when you aren’t in the right environment to manage it.
🧱 Support & Resistance Levels
Resistance Zones: 23,935 | 24,080 | 24,185 | 24,300 ~ 24,333
Support Zones: 23,840 | 23,780 | 23,700
🧠 Final Thoughts
“The floor at 23,800 is the final stand for the bulls.”
Today’s price action was discouraging for anyone looking for a bottom. The way Nifty sliced through support levels suggests that the “panic dust” hasn’t settled yet.
Tomorrow’s closing will be the ultimate confirmation; if we break 23,800, we must prepare for a much deeper correction toward 23,200.
I will be back at my desk tomorrow to let the Initial Balance (IB) guide the next steps.
✏️ Disclaimer
This is my personal digital diary and represents my own analysis and point of view. It is not financial advice; please consult a professional advisor before making any trading decisions.
23,800 Crisis: Nifty Slumps to Lowest Close Since April 2025!
🗞 Nifty Summary
The Nifty started the session with a minor 22-point Gap Down, but any hopes for a recovery were dashed almost immediately.
Following a flat opening tick, the index made a feeble attempt to test the 24,300 ~ 24,330 resistance zone mentioned in yesterday’s diary.
After a sharp rejection from this level, Nifty entered a “slow yet brutal” downward spiral. It rolled down without respecting any support levels, with pullbacks limited to a mere 50-60 points—never enough to threaten the bears’ control.
The index eventually closed near the absolute bottom of the day at 23,848.20 (Adjusted close: 23,866.85), losing -394.75 points (-1.63%).
Today’s session was a masterclass in persistent selling pressure. By finishing at these levels, Nifty has recorded its lowest close since April 21, 2025.
We are now sitting on the edge of the 23,800 critical floor. If this level fails to hold on a closing basis in the coming sessions, the structural damage could extend the fall toward the 23,200 level.
🛡 5 Min Intraday Chart with Levels
📉 Daily Time Frame Chart with Intraday Levels
🕯 Daily Candle Breakdown
Open: 24,231.85
High: 24,299.00
Low: 23,834.30
Close: 23,866.85
Change: -394.75 (-1.63%)
🏗️ Structure Breakdown
Type: Strong Bearish Candle (Full Body).
Range: ≈ 465 points — Extremely high volatility.
Body: ≈ 365 points — Reflects aggressive and dominant selling pressure.
Upper Wick: ≈ 67 points — Failed attempt to reclaim the 24,300 resistance.
Lower Wick: ≈ 32 points — Very limited buying interest near the day’s lows.
🛡 5 Min Intraday Chart
⚔️ Gladiator Strategy Update
ATR: 384.25
IB Range: 154.35 → Medium
Market Structure: Balanced (Initially) → Imbalance
Trade Highlights:
No Trade
Trade Summary: I was not available at my desk today, and my personal rules strictly forbid remote trading via mobile or other devices. While the market provided a clear directional move, staying disciplined to my rules is more important than catching a move. Sometimes the best trade is the one you don’t take when you aren’t in the right environment to manage it.
🧱 Support & Resistance Levels
Resistance Zones: 23,935 | 24,080 | 24,185 | 24,300 ~ 24,333
Support Zones: 23,840 | 23,780 | 23,700
🧠 Final Thoughts
“The floor at 23,800 is the final stand for the bulls.”
Today’s price action was discouraging for anyone looking for a bottom. The way Nifty sliced through support levels suggests that the “panic dust” hasn’t settled yet.
Tomorrow’s closing will be the ultimate confirmation; if we break 23,800, we must prepare for a much deeper correction toward 23,200.
I will be back at my desk tomorrow to let the Initial Balance (IB) guide the next steps.
✏️ Disclaimer
This is my personal digital diary and represents my own analysis and point of view. It is not financial advice; please consult a professional advisor before making any trading decisions.

Read my blogs here:
substack.com/@kzatakia
Follow me on Telegram:
t.me/swingtraderhub
Follow me on X:
x.com/kzatakia
substack.com/@kzatakia
Follow me on Telegram:
t.me/swingtraderhub
Follow me on X:
x.com/kzatakia
Pubblicazioni correlate
Declinazione di responsabilità
Le informazioni e le pubblicazioni non sono intese come, e non costituiscono, consulenza o raccomandazioni finanziarie, di investimento, di trading o di altro tipo fornite o approvate da TradingView. Per ulteriori informazioni, consultare i Termini di utilizzo.
Read my blogs here:
substack.com/@kzatakia
Follow me on Telegram:
t.me/swingtraderhub
Follow me on X:
x.com/kzatakia
substack.com/@kzatakia
Follow me on Telegram:
t.me/swingtraderhub
Follow me on X:
x.com/kzatakia
Pubblicazioni correlate
Declinazione di responsabilità
Le informazioni e le pubblicazioni non sono intese come, e non costituiscono, consulenza o raccomandazioni finanziarie, di investimento, di trading o di altro tipo fornite o approvate da TradingView. Per ulteriori informazioni, consultare i Termini di utilizzo.