
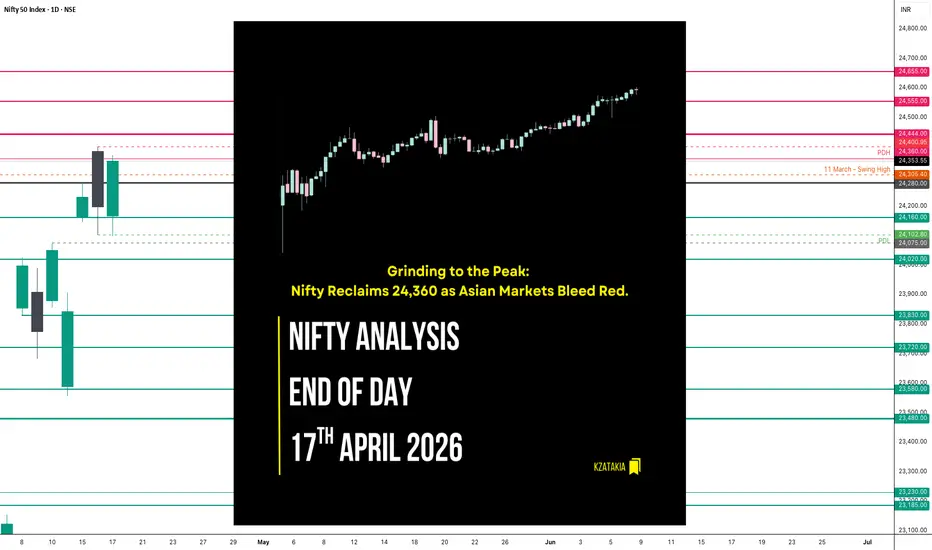
🟢 Nifty Analysis EOD – April 17, 2026 – Friday 🔴
Grinding to the Peak: Nifty Reclaims 24,360 as Asian Markets Bleed Red.
🗞 Nifty Summary
After what feels like a very long time, Nifty opened relatively flat with a minor 13-point Gap Down. The initial weakness saw a 79-point slide that tested yesterday’s support level of 24,100.
However, the bears were quickly rebuffed; within a single minute, a sharp recovery surged 138 points. The index initially faced friction at 24,225, but bulls gradually pushed through to reach the critical 24,280 level.
For the majority of the session (until 1:25 PM), Nifty hovered around this 24,280 zone, with the March 11th high acting as the upper band and the Initial Balance High (IBH) acting as the lower band. In the final hours, the index climbed confidently to the 24,360 level, ending the day at 24,366.90, nearly at the day’s peak. On a closing basis, Nifty gained +156.80 points (+0.65%).
Technically, today’s close is highly significant as Nifty finished above the closes of the previous 24 sessions. We are now 1,122 points away from the day-high recorded when the war began.
Remarkably, while most Asian markets were in the red today, the Indian market remained strongly bullish, with only the IT index (-0.02%) marking a marginal red close.
🛡 5 Min Intraday Chart with Levels

📉 Daily Time Frame Chart with Intraday Levels

🕯 Daily Candle Breakdown
Open: 24,165.90
High: 24,371.90
Low: 24,096.05
Close: 24,353.55
Change: +156.80 (+0.65%)
🏗️ Structure Breakdown
Type: Bullish candle (Close above Open with positive continuation).
Range: ≈ 276 points — Moderate to high volatility.
Body: ≈ 188 points — Reflects strong buying pressure throughout the session.
Upper Wick: ≈ 18 points — Minimal resistance encountered near the day’s high.
Lower Wick: ≈ 70 points — Decent buying support found on the early dip.
🛡 5 Min Intraday Chart

⚔️ Gladiator Strategy Update
ATR: 446.16
IB Range: 142.50 → Small
Market Structure: Balanced
Trade Highlights:
09:56 Long Trade: SL Hit
10:03 Long Trade: Trailing SL Hit
11:53 Long Trade: SL Hit
Trade Summary:
Today was a frustrating day at the terminal for my execution. Despite the market ending strongly in the green, the intraday path was filled with “micro-churn” that triggered my stop-losses. It’s a classic case of being right on the trend but wrong on the timing or the wiggle room provided. I took three long attempts, and none of them yielded the expected targets due to early stop-outs. This is a humble reminder that a green day for the index doesn’t always mean a green day for every trader.
🧱 Support & Resistance Levels
Resistance Zones: 24,360 ~ 24,444 (Immediate) | 24,555 | 24,655
Support Zones: 24,160 | 24,075 ~ 24,100 | 24,020 | 23,830
🧠 Final Thoughts
“Strength is visible, but the setup is still under construction.”
Opposite to yesterday’s structure, Nifty today marked a Lower Low and a Lower High on an intraday basis, yet gave a higher close. This configuration usually points to high volatility in the upcoming sessions. While the market is showing undeniable strength compared to global peers, the upside currently faces heavy overhead resistance.
There is currently no clear confluence for an aggressive long or a high-conviction short. Therefore, there is nothing to do but wait for a fresh setup to build. I will remain patient and let the Initial Balance on Monday dictate the next move.
✏️ Disclaimer
This is my personal digital diary and represents my own analysis and point of view. It is not financial advice; please consult a professional advisor before making any trading decisions.
Grinding to the Peak: Nifty Reclaims 24,360 as Asian Markets Bleed Red.
🗞 Nifty Summary
After what feels like a very long time, Nifty opened relatively flat with a minor 13-point Gap Down. The initial weakness saw a 79-point slide that tested yesterday’s support level of 24,100.
However, the bears were quickly rebuffed; within a single minute, a sharp recovery surged 138 points. The index initially faced friction at 24,225, but bulls gradually pushed through to reach the critical 24,280 level.
For the majority of the session (until 1:25 PM), Nifty hovered around this 24,280 zone, with the March 11th high acting as the upper band and the Initial Balance High (IBH) acting as the lower band. In the final hours, the index climbed confidently to the 24,360 level, ending the day at 24,366.90, nearly at the day’s peak. On a closing basis, Nifty gained +156.80 points (+0.65%).
Technically, today’s close is highly significant as Nifty finished above the closes of the previous 24 sessions. We are now 1,122 points away from the day-high recorded when the war began.
Remarkably, while most Asian markets were in the red today, the Indian market remained strongly bullish, with only the IT index (-0.02%) marking a marginal red close.
🛡 5 Min Intraday Chart with Levels
📉 Daily Time Frame Chart with Intraday Levels
🕯 Daily Candle Breakdown
Open: 24,165.90
High: 24,371.90
Low: 24,096.05
Close: 24,353.55
Change: +156.80 (+0.65%)
🏗️ Structure Breakdown
Type: Bullish candle (Close above Open with positive continuation).
Range: ≈ 276 points — Moderate to high volatility.
Body: ≈ 188 points — Reflects strong buying pressure throughout the session.
Upper Wick: ≈ 18 points — Minimal resistance encountered near the day’s high.
Lower Wick: ≈ 70 points — Decent buying support found on the early dip.
🛡 5 Min Intraday Chart
⚔️ Gladiator Strategy Update
ATR: 446.16
IB Range: 142.50 → Small
Market Structure: Balanced
Trade Highlights:
09:56 Long Trade: SL Hit
10:03 Long Trade: Trailing SL Hit
11:53 Long Trade: SL Hit
Trade Summary:
Today was a frustrating day at the terminal for my execution. Despite the market ending strongly in the green, the intraday path was filled with “micro-churn” that triggered my stop-losses. It’s a classic case of being right on the trend but wrong on the timing or the wiggle room provided. I took three long attempts, and none of them yielded the expected targets due to early stop-outs. This is a humble reminder that a green day for the index doesn’t always mean a green day for every trader.
🧱 Support & Resistance Levels
Resistance Zones: 24,360 ~ 24,444 (Immediate) | 24,555 | 24,655
Support Zones: 24,160 | 24,075 ~ 24,100 | 24,020 | 23,830
🧠 Final Thoughts
“Strength is visible, but the setup is still under construction.”
Opposite to yesterday’s structure, Nifty today marked a Lower Low and a Lower High on an intraday basis, yet gave a higher close. This configuration usually points to high volatility in the upcoming sessions. While the market is showing undeniable strength compared to global peers, the upside currently faces heavy overhead resistance.
There is currently no clear confluence for an aggressive long or a high-conviction short. Therefore, there is nothing to do but wait for a fresh setup to build. I will remain patient and let the Initial Balance on Monday dictate the next move.
✏️ Disclaimer
This is my personal digital diary and represents my own analysis and point of view. It is not financial advice; please consult a professional advisor before making any trading decisions.

Read my blogs here:
substack.com/@kzatakia
Follow me on Telegram:
t.me/swingtraderhub
Follow me on X:
x.com/kzatakia
substack.com/@kzatakia
Follow me on Telegram:
t.me/swingtraderhub
Follow me on X:
x.com/kzatakia
Pubblicazioni correlate
Declinazione di responsabilità
Le informazioni e le pubblicazioni non sono intese come, e non costituiscono, consulenza o raccomandazioni finanziarie, di investimento, di trading o di altro tipo fornite o approvate da TradingView. Per ulteriori informazioni, consultare i Termini di utilizzo.
Read my blogs here:
substack.com/@kzatakia
Follow me on Telegram:
t.me/swingtraderhub
Follow me on X:
x.com/kzatakia
substack.com/@kzatakia
Follow me on Telegram:
t.me/swingtraderhub
Follow me on X:
x.com/kzatakia
Pubblicazioni correlate
Declinazione di responsabilità
Le informazioni e le pubblicazioni non sono intese come, e non costituiscono, consulenza o raccomandazioni finanziarie, di investimento, di trading o di altro tipo fornite o approvate da TradingView. Per ulteriori informazioni, consultare i Termini di utilizzo.