
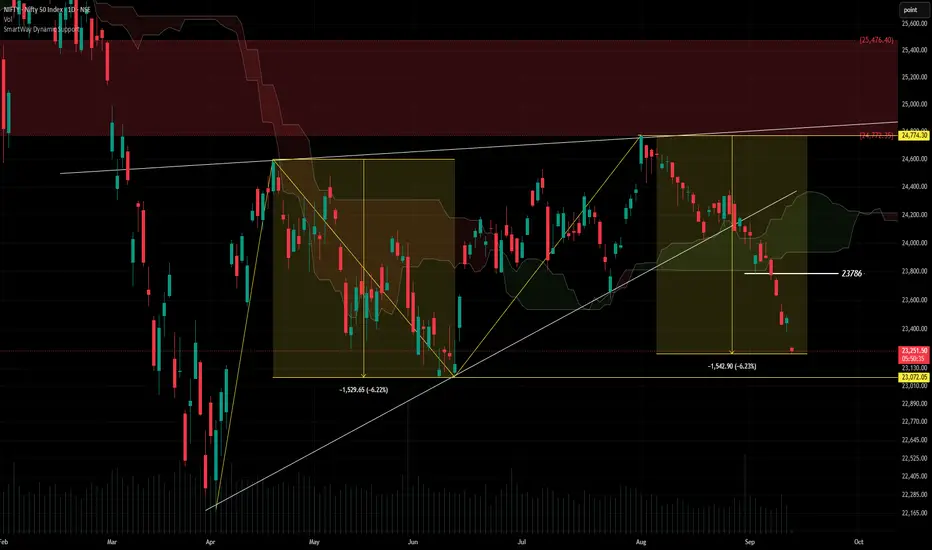
Market corrections often move in repeating, structural patterns. In technical analysis, identifying these symmetrical price drops helps traders understand market mechanics, manage risk, and identify potential support zones without relying on guesswork.
Here is an educational breakdown of the geometric price symmetry shown in this chart:
## Understanding Measured Moves and Price Symmetry
When a market enters a corrective phase, it rarely falls in a straight line. Instead, it moves in swings. Price symmetry occurs when two or more separate downward market swings match each other almost perfectly in distance (price points) and percentage.
* The Principle: Markets have a "memory." The same institutional selling pressure, margin liquidations, or profit-taking behavior that drove a previous correction will often replicate itself in a future correction.
* The Blueprint: If Swing A drops by a specific amount, analysts look for Swing B to drop by a highly similar magnitude once a new peak is established.
## Key Components of Symmetrical Falls
To study this pattern on a chart, technical analysts look for three main structural elements:
1. The Initial Drop (Swing 1): A clear, defined decline from a major swing high to a swing low. This establishes the baseline measurement (e.g., a ~6.2% decline).
2. The Intervening Rally: A temporary upward retracement where buyers step back in. This peak sets the starting point for the next measurement.
3. The Symmetrical Drop (Swing 2): A second decline originating from the new lower high or secondary peak. As shown in the chart, this second drop replicates the exact percentage depth (-6.23%) of the first drop.
## Why Traders Study Symmetrical Ranges
* Identifying High-Consequence Support: When a secondary drop approaches the exact measured length of a prior drop, that price level becomes a high-probability area for a potential bounce or consolidation.
* Objective Target Setting: Instead of guessing how far a market might slide, measured moves offer a mathematical, data-driven target based on historical asset behavior.
* Risk Mitigation: Recognizing that a correction has reached its historical "symmetrical limit" helps prevent traders from panic-selling at the absolute bottom of a structural move.
If you want to dive deeper into this pattern, let me know if you would like to look at:
* How to draw Fibonacci extension and expansion tools to map these automatically.
* The difference between harmonic patterns and simple measured moves.
* How volume or momentum oscillators typically behave at the completion point of a symmetrical fall.
Here is an educational breakdown of the geometric price symmetry shown in this chart:
## Understanding Measured Moves and Price Symmetry
When a market enters a corrective phase, it rarely falls in a straight line. Instead, it moves in swings. Price symmetry occurs when two or more separate downward market swings match each other almost perfectly in distance (price points) and percentage.
* The Principle: Markets have a "memory." The same institutional selling pressure, margin liquidations, or profit-taking behavior that drove a previous correction will often replicate itself in a future correction.
* The Blueprint: If Swing A drops by a specific amount, analysts look for Swing B to drop by a highly similar magnitude once a new peak is established.
## Key Components of Symmetrical Falls
To study this pattern on a chart, technical analysts look for three main structural elements:
1. The Initial Drop (Swing 1): A clear, defined decline from a major swing high to a swing low. This establishes the baseline measurement (e.g., a ~6.2% decline).
2. The Intervening Rally: A temporary upward retracement where buyers step back in. This peak sets the starting point for the next measurement.
3. The Symmetrical Drop (Swing 2): A second decline originating from the new lower high or secondary peak. As shown in the chart, this second drop replicates the exact percentage depth (-6.23%) of the first drop.
## Why Traders Study Symmetrical Ranges
* Identifying High-Consequence Support: When a secondary drop approaches the exact measured length of a prior drop, that price level becomes a high-probability area for a potential bounce or consolidation.
* Objective Target Setting: Instead of guessing how far a market might slide, measured moves offer a mathematical, data-driven target based on historical asset behavior.
* Risk Mitigation: Recognizing that a correction has reached its historical "symmetrical limit" helps prevent traders from panic-selling at the absolute bottom of a structural move.
If you want to dive deeper into this pattern, let me know if you would like to look at:
* How to draw Fibonacci extension and expansion tools to map these automatically.
* The difference between harmonic patterns and simple measured moves.
* How volume or momentum oscillators typically behave at the completion point of a symmetrical fall.

Sucrit.D.Patil
Declinazione di responsabilità
Le informazioni e le pubblicazioni non sono intese come, e non costituiscono, consulenza o raccomandazioni finanziarie, di investimento, di trading o di altro tipo fornite o approvate da TradingView. Per ulteriori informazioni, consultare i Termini di utilizzo.
Sucrit.D.Patil
Declinazione di responsabilità
Le informazioni e le pubblicazioni non sono intese come, e non costituiscono, consulenza o raccomandazioni finanziarie, di investimento, di trading o di altro tipo fornite o approvate da TradingView. Per ulteriori informazioni, consultare i Termini di utilizzo.