
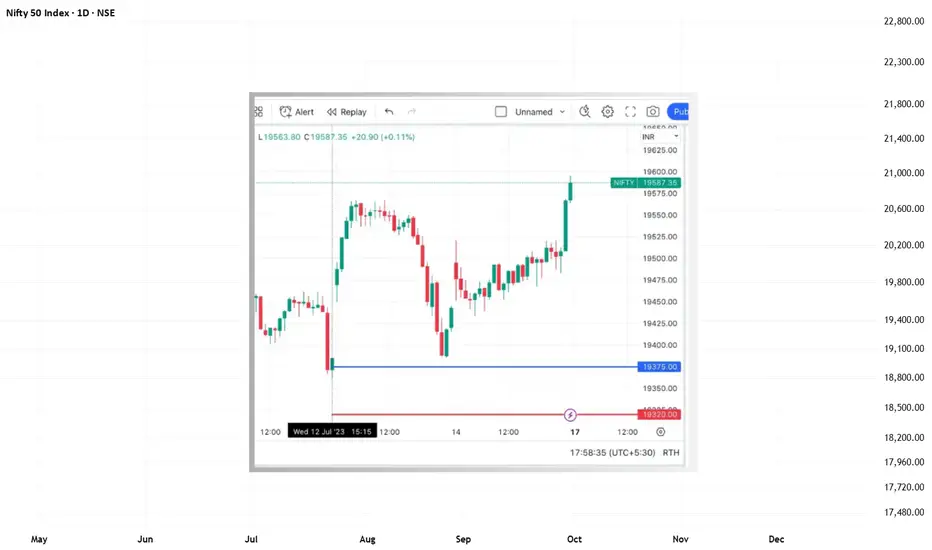
(12 July 2023 | WD Gann Methodology)
This idea is a historical, educational study demonstrating how price structure and time alignment, as described in classical WD Gann methodology, can be analysed on an intraday chart.
This post is not a trade call, prediction, or recommendation.
📌 Market Context
On 12 July 2023, Nifty was trading within a short-term consolidation phase after a prior decline.
According to WD Gann principles:
📈 What the Chart Illustrates
The chart highlights:
This example is shared to explain how price structure can be studied objectively, without emotional bias.
🧠 Key Learning Points
The focus here is on process, structure, and risk awareness, not outcome.
⚠ Disclaimer
This idea is shared strictly for educational and analytical purposes only.
It does not constitute financial advice, live trade calls, or investment recommendations.
This idea is a historical, educational study demonstrating how price structure and time alignment, as described in classical WD Gann methodology, can be analysed on an intraday chart.
This post is not a trade call, prediction, or recommendation.
📌 Market Context
On 12 July 2023, Nifty was trading within a short-term consolidation phase after a prior decline.
According to WD Gann principles:
- Markets often react near structural price levels
- These levels gain importance when price and time balance
- Risk is always defined before observing market response
📈 What the Chart Illustrates
The chart highlights:
- A reference price zone derived from prior structure
- A downside risk boundary used for invalidation
- Subsequent price response after interaction with the level
This example is shared to explain how price structure can be studied objectively, without emotional bias.
🧠 Key Learning Points
- Gann analysis begins with price structure
- Risk must be pre-defined, not adjusted later
- Time confirms whether price is accepted or rejected
- Studying completed sessions improves execution discipline
The focus here is on process, structure, and risk awareness, not outcome.
⚠ Disclaimer
This idea is shared strictly for educational and analytical purposes only.
It does not constitute financial advice, live trade calls, or investment recommendations.

Pubblicazioni correlate
Declinazione di responsabilità
Le informazioni e le pubblicazioni non sono intese come, e non costituiscono, consulenza o raccomandazioni finanziarie, di investimento, di trading o di altro tipo fornite o approvate da TradingView. Per ulteriori informazioni, consultare i Termini di utilizzo.