
📌 NIFTY MIDCAP SELECT – Recovery Within Broader Weak Structure Near Key Supply
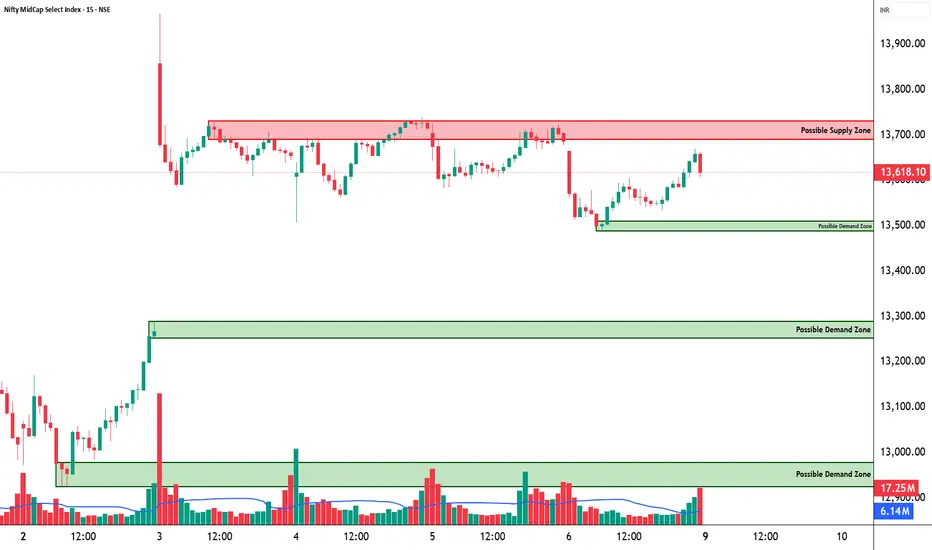
The NIFTY Midcap Select index is attempting a gradual recovery after finding support near the 13,500 demand zone, indicating responsive buying at lower levels but not yet signalling a confirmed shift in trend. Price is currently hovering around 13,600–13,650, approaching an important overhead resistance cluster. Immediate resistance is placed at 13,713.67, followed by a stronger resistance band near 13,782.43, while the major structural ceiling is positioned around 13,894.87, marking a zone where prior rallies have faced rejection and supply remains active.
On the downside, immediate support is seen at 13,532.47, which aligns closely with the highlighted demand pocket. Below this, deeper supports are positioned at 13,420.03 and 13,351.27, creating a layered cushion that could absorb declines if selling pressure resurfaces. The chart clearly identifies a primary demand zone between 13,480–13,520, whereas the supply zone is concentrated near 13,700–13,780, suggesting the index is currently rotating between value areas rather than establishing directional momentum.
The CPR structure remains sideways and positioned in a bearish zone, reflecting value shifting lower despite the short-term bounce. The dashboard further signals low momentum and no clear directional edge, reinforcing the likelihood of consolidation before the next meaningful move.
Overall, the index appears to be undergoing a technical pullback within a broader downtrend, with recovery attempts likely to face supply unless supported by stronger participation. Sustaining above 13,530 can keep the short-term tone stable, but only a decisive breakout above 13,780–13,900 would signal improving structure and potential trend repair.
📊 Midcap sentiment remains cautious. While domestic liquidity continues to support broader markets, investors have shown selective participation in midcaps after recent volatility, leading to rotational moves rather than aggressive accumulation.
🔎 Probabilistic Tilt Based on Levels & Environment:
Bullish Scenario: A sustained move above 13,713–13,780 could trigger recovery toward 13,900, signalling renewed risk appetite.
Neutral / Choppy Scenario: Holding between 13,500–13,780 would indicate continued consolidation as the index stabilises after recent declines.
Bearish Scenario: Failure to hold 13,532 may expose the index to deeper retracement toward 13,420–13,350, keeping the broader corrective structure intact.
⚠️ Disclaimer:
This content is shared purely for educational and informational purposes to enhance market understanding. It should not be construed as investment, trading, or financial advice. Market conditions can change rapidly, and past price behaviour does not guarantee future outcomes. Please consult a SEBI-registered financial advisor before making any investment or trading decisions, and ensure appropriate risk management at all times.
The NIFTY Midcap Select index is attempting a gradual recovery after finding support near the 13,500 demand zone, indicating responsive buying at lower levels but not yet signalling a confirmed shift in trend. Price is currently hovering around 13,600–13,650, approaching an important overhead resistance cluster. Immediate resistance is placed at 13,713.67, followed by a stronger resistance band near 13,782.43, while the major structural ceiling is positioned around 13,894.87, marking a zone where prior rallies have faced rejection and supply remains active.
On the downside, immediate support is seen at 13,532.47, which aligns closely with the highlighted demand pocket. Below this, deeper supports are positioned at 13,420.03 and 13,351.27, creating a layered cushion that could absorb declines if selling pressure resurfaces. The chart clearly identifies a primary demand zone between 13,480–13,520, whereas the supply zone is concentrated near 13,700–13,780, suggesting the index is currently rotating between value areas rather than establishing directional momentum.
The CPR structure remains sideways and positioned in a bearish zone, reflecting value shifting lower despite the short-term bounce. The dashboard further signals low momentum and no clear directional edge, reinforcing the likelihood of consolidation before the next meaningful move.
Overall, the index appears to be undergoing a technical pullback within a broader downtrend, with recovery attempts likely to face supply unless supported by stronger participation. Sustaining above 13,530 can keep the short-term tone stable, but only a decisive breakout above 13,780–13,900 would signal improving structure and potential trend repair.
📊 Midcap sentiment remains cautious. While domestic liquidity continues to support broader markets, investors have shown selective participation in midcaps after recent volatility, leading to rotational moves rather than aggressive accumulation.
🔎 Probabilistic Tilt Based on Levels & Environment:
Bullish Scenario: A sustained move above 13,713–13,780 could trigger recovery toward 13,900, signalling renewed risk appetite.
Neutral / Choppy Scenario: Holding between 13,500–13,780 would indicate continued consolidation as the index stabilises after recent declines.
Bearish Scenario: Failure to hold 13,532 may expose the index to deeper retracement toward 13,420–13,350, keeping the broader corrective structure intact.
⚠️ Disclaimer:
This content is shared purely for educational and informational purposes to enhance market understanding. It should not be construed as investment, trading, or financial advice. Market conditions can change rapidly, and past price behaviour does not guarantee future outcomes. Please consult a SEBI-registered financial advisor before making any investment or trading decisions, and ensure appropriate risk management at all times.

STWP | Mentor & Demand-Supply Specialist |
Empowering traders through structured learning |
simpletradewithpatience.com
chat.whatsapp.com/CpgyHCfioQ5Hxf7rd8pDqw
wa.me/message/6IOPHGOXMGZ4N1
Educational Only
Empowering traders through structured learning |
simpletradewithpatience.com
chat.whatsapp.com/CpgyHCfioQ5Hxf7rd8pDqw
wa.me/message/6IOPHGOXMGZ4N1
Educational Only
Declinazione di responsabilità
Le informazioni e le pubblicazioni non sono intese come, e non costituiscono, consulenza o raccomandazioni finanziarie, di investimento, di trading o di altro tipo fornite o approvate da TradingView. Per ulteriori informazioni, consultare i Termini di utilizzo.
STWP | Mentor & Demand-Supply Specialist |
Empowering traders through structured learning |
simpletradewithpatience.com
chat.whatsapp.com/CpgyHCfioQ5Hxf7rd8pDqw
wa.me/message/6IOPHGOXMGZ4N1
Educational Only
Empowering traders through structured learning |
simpletradewithpatience.com
chat.whatsapp.com/CpgyHCfioQ5Hxf7rd8pDqw
wa.me/message/6IOPHGOXMGZ4N1
Educational Only
Declinazione di responsabilità
Le informazioni e le pubblicazioni non sono intese come, e non costituiscono, consulenza o raccomandazioni finanziarie, di investimento, di trading o di altro tipo fornite o approvate da TradingView. Per ulteriori informazioni, consultare i Termini di utilizzo.