
Breakout structure on NLC India Ltd -Ascending Triangle Breakout
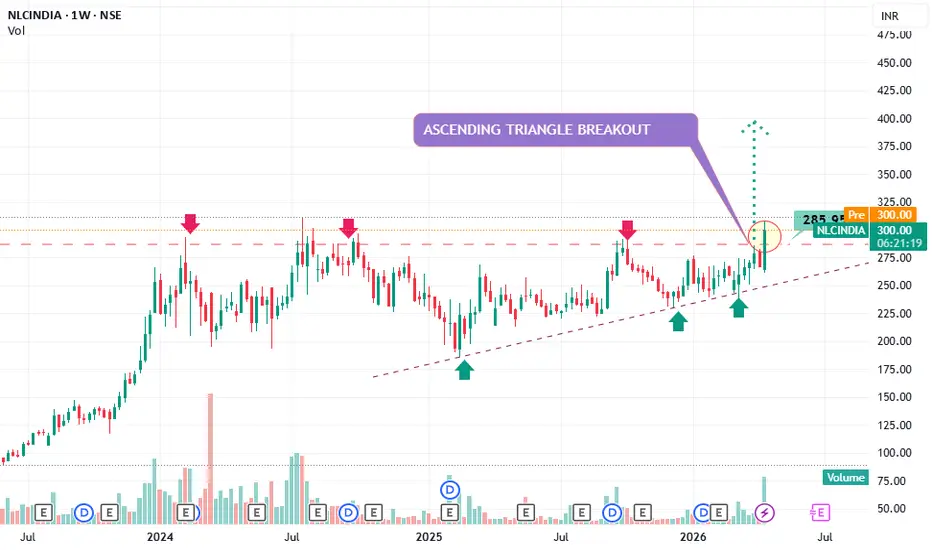
Flat resistance zone: ~₹285–₹290 (multiple rejections marked by red arrows)
Rising trendline: Higher lows (green arrows) showing accumulation
This pattern signals buyers getting stronger over time
👉 Classic bullish continuation setup.
Breakout Confirmation
Price has closed above resistance (~₹285)
Strong bullish candle with volume support (46M+)
This is not a fake breakout — structure + volume both aligned
Targets (Based on Pattern Projection)
Immediate target: ₹320–₹330
Measured move target: ₹360–₹380
Stretch target (momentum rally): ₹400+
Risk Management
Ideal Stop Loss: ₹270 (below breakout zone)
Aggressive traders: ₹275
📊 What Makes This Trade Strong?
Multi-month consolidation breakout
Higher lows = institutional accumulation
PSU power sector showing strength
Clean technical structure (easy to manage risk
Conservative traders: Wait for retest near ₹285
Rising trendline: Higher lows (green arrows) showing accumulation
This pattern signals buyers getting stronger over time
👉 Classic bullish continuation setup.
Breakout Confirmation
Price has closed above resistance (~₹285)
Strong bullish candle with volume support (46M+)
This is not a fake breakout — structure + volume both aligned
Targets (Based on Pattern Projection)
Immediate target: ₹320–₹330
Measured move target: ₹360–₹380
Stretch target (momentum rally): ₹400+
Risk Management
Ideal Stop Loss: ₹270 (below breakout zone)
Aggressive traders: ₹275
📊 What Makes This Trade Strong?
Multi-month consolidation breakout
Higher lows = institutional accumulation
PSU power sector showing strength
Clean technical structure (easy to manage risk
Conservative traders: Wait for retest near ₹285

Declinazione di responsabilità
Le informazioni e le pubblicazioni non sono intese come, e non costituiscono, consulenza o raccomandazioni finanziarie, di investimento, di trading o di altro tipo fornite o approvate da TradingView. Per ulteriori informazioni, consultare i Termini di utilizzo.
Declinazione di responsabilità
Le informazioni e le pubblicazioni non sono intese come, e non costituiscono, consulenza o raccomandazioni finanziarie, di investimento, di trading o di altro tipo fornite o approvate da TradingView. Per ulteriori informazioni, consultare i Termini di utilizzo.