
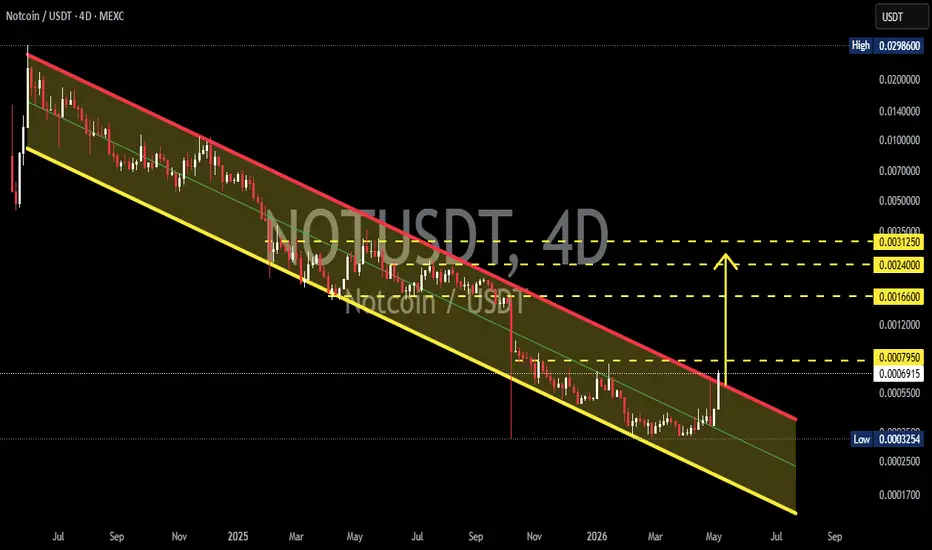
📊 On the 4D timeframe, NOT/USDT has successfully broken out from a long-term Descending Channel pattern that had suppressed the price for months. This breakout could be an early signal that bearish pressure is weakening and bullish momentum is starting to enter the market.
The channel structure reflects a very consistent downtrend since the previous highs, but price is now attempting to break above the major channel resistance and reclaim important levels.
---
📉 Pattern Formation: Descending Channel
The main pattern visible on this chart is:
🔹 A Descending Channel is generally considered a bearish continuation pattern formed by lower highs and lower lows within two parallel descending trendlines.
🔹 However, once price successfully breaks above the upper resistance trendline, the pattern can shift into a bullish reversal signal or at least trigger a strong relief rally.
🔹 In this chart, the breakout appears increasingly valid as the candle has moved above the upper channel resistance after a long accumulation phase near the bottom area.
---
🟢 Bullish Scenario 🚀
✅ If price manages to hold above the breakout zone, NOT could continue its upward movement toward several key resistance levels:
🎯 Target 1 : 0.0007950
🎯 Target 2 : 0.0016600
🎯 Target 3 : 0.0024000
🎯 Target 4 : 0.0031250
📌 The 0.0007950 area becomes the nearest resistance and the first major confirmation zone to determine whether this breakout has enough strength for continuation.
📌 If buying volume increases and price closes strongly above that resistance, the probability of a bullish continuation becomes significantly stronger.
📌 Structurally, breakouts from large channels on higher timeframes often produce aggressive price movements, especially when overall crypto market sentiment is supportive.
---
🔴 Bearish Scenario ⚠️
⚠️ Even though the breakout is visible, the possibility of a fakeout still remains.
A bearish scenario may occur if:
❌ Price fails to hold above the breakout line
❌ Candles move back inside the descending channel
❌ Buying volume starts weakening
❌ Strong rejection appears at nearby resistance levels
📉 If this happens, price could revisit the lower support zone of the channel and potentially retest previous lows.
📌 The low area around 0.0003254 becomes a crucial support zone that buyers must defend.
📌 Losing this level could reopen the path for deeper downside movement and restore medium-term bearish dominance.
---
📌 Conclusion 🔥
NOT/USDT is currently at a very interesting phase after breaking out from a major descending channel on the higher timeframe.
The next movement will determine whether this is truly the beginning of a major bullish reversal or simply a temporary bounce before continuing the larger downtrend.
📊 Traders should closely monitor:
✅ Breakout volume confirmation
✅ Retest of the breakout area
✅ Price stability above nearby resistance
As long as price remains outside the channel, the bullish potential remains significantly open.
#NOTUSDT #NOTCoin #Crypto #Altcoin #TechnicalAnalysis #CryptoTrading #Bullish #Breakout #DescendingChannel #CryptoMarket #PriceAction #SupportResistance #Altseason #ChartAnalysis
The channel structure reflects a very consistent downtrend since the previous highs, but price is now attempting to break above the major channel resistance and reclaim important levels.
---
📉 Pattern Formation: Descending Channel
The main pattern visible on this chart is:
🔹 A Descending Channel is generally considered a bearish continuation pattern formed by lower highs and lower lows within two parallel descending trendlines.
🔹 However, once price successfully breaks above the upper resistance trendline, the pattern can shift into a bullish reversal signal or at least trigger a strong relief rally.
🔹 In this chart, the breakout appears increasingly valid as the candle has moved above the upper channel resistance after a long accumulation phase near the bottom area.
---
🟢 Bullish Scenario 🚀
✅ If price manages to hold above the breakout zone, NOT could continue its upward movement toward several key resistance levels:
🎯 Target 1 : 0.0007950
🎯 Target 2 : 0.0016600
🎯 Target 3 : 0.0024000
🎯 Target 4 : 0.0031250
📌 The 0.0007950 area becomes the nearest resistance and the first major confirmation zone to determine whether this breakout has enough strength for continuation.
📌 If buying volume increases and price closes strongly above that resistance, the probability of a bullish continuation becomes significantly stronger.
📌 Structurally, breakouts from large channels on higher timeframes often produce aggressive price movements, especially when overall crypto market sentiment is supportive.
---
🔴 Bearish Scenario ⚠️
⚠️ Even though the breakout is visible, the possibility of a fakeout still remains.
A bearish scenario may occur if:
❌ Price fails to hold above the breakout line
❌ Candles move back inside the descending channel
❌ Buying volume starts weakening
❌ Strong rejection appears at nearby resistance levels
📉 If this happens, price could revisit the lower support zone of the channel and potentially retest previous lows.
📌 The low area around 0.0003254 becomes a crucial support zone that buyers must defend.
📌 Losing this level could reopen the path for deeper downside movement and restore medium-term bearish dominance.
---
📌 Conclusion 🔥
NOT/USDT is currently at a very interesting phase after breaking out from a major descending channel on the higher timeframe.
The next movement will determine whether this is truly the beginning of a major bullish reversal or simply a temporary bounce before continuing the larger downtrend.
📊 Traders should closely monitor:
✅ Breakout volume confirmation
✅ Retest of the breakout area
✅ Price stability above nearby resistance
As long as price remains outside the channel, the bullish potential remains significantly open.
#NOTUSDT #NOTCoin #Crypto #Altcoin #TechnicalAnalysis #CryptoTrading #Bullish #Breakout #DescendingChannel #CryptoMarket #PriceAction #SupportResistance #Altseason #ChartAnalysis

✅ Get Free Signals! Join Our Telegram Channel Here: t.me/TheCryptoNuclear
✅ Twitter: twitter.com/crypto_nuclear
✅ Join Bybit : partner.bybit.com/b/nuclearvip
✅ Benefits : Lifetime Trading Fee Discount -50%
✅ Twitter: twitter.com/crypto_nuclear
✅ Join Bybit : partner.bybit.com/b/nuclearvip
✅ Benefits : Lifetime Trading Fee Discount -50%
Declinazione di responsabilità
Le informazioni e le pubblicazioni non sono intese come, e non costituiscono, consulenza o raccomandazioni finanziarie, di investimento, di trading o di altro tipo fornite o approvate da TradingView. Per ulteriori informazioni, consultare i Termini di utilizzo.
✅ Get Free Signals! Join Our Telegram Channel Here: t.me/TheCryptoNuclear
✅ Twitter: twitter.com/crypto_nuclear
✅ Join Bybit : partner.bybit.com/b/nuclearvip
✅ Benefits : Lifetime Trading Fee Discount -50%
✅ Twitter: twitter.com/crypto_nuclear
✅ Join Bybit : partner.bybit.com/b/nuclearvip
✅ Benefits : Lifetime Trading Fee Discount -50%
Declinazione di responsabilità
Le informazioni e le pubblicazioni non sono intese come, e non costituiscono, consulenza o raccomandazioni finanziarie, di investimento, di trading o di altro tipo fornite o approvate da TradingView. Per ulteriori informazioni, consultare i Termini di utilizzo.