
The Relative Strength Index (RSI), developed by J. Welles Wilder in 1978, remains one of the most widely used technical indicators among retail traders. The conventional wisdom suggests that RSI values below 30 indicate oversold conditions (a buy signal) and values above 70 indicate overbought conditions (a sell signal). This study tests these claims across over one million parameter combinations, 16 different assets spanning five asset classes, and over two decades of market data. Our findings are unambiguous: the RSI overbought/oversold strategy provides no statistically significant edge after correcting for multiple testing. The results challenge fundamental assumptions held by millions of retail traders worldwide and raise important questions about the perpetuation of ineffective trading methodologies through popular financial education.
1. Introduction
Open any beginner's guide to technical analysis, or watch any YouTube tutorial on day trading, and you will encounter the same advice: buy when the RSI drops below 30, sell when it rises above 70. This recommendation has achieved the status of gospel truth among retail traders, repeated so frequently that its validity is rarely questioned. But what if this cornerstone of technical analysis is built on sand?
The RSI was introduced by Wilder (1978) in his influential book "New Concepts in Technical Trading Systems." Originally designed as a momentum oscillator to identify the speed and magnitude of price movements, the indicator has since been co-opted into a mean-reversion tool by generations of retail traders. This transformation occurred largely without empirical validation, propagated instead through repetition in trading education materials.
The financial implications of this belief are substantial. According to research by Barber and Odean (2000), individual investors who trade frequently underperform passive benchmarks by approximately 6.5 percentage points annually. While multiple factors contribute to this underperformance, the use of ineffective trading signals certainly plays a role. If millions of traders base entry and exit decisions on a fundamentally flawed premise, the aggregate wealth destruction becomes a matter of public interest.
This study aims to provide definitive evidence regarding the efficacy of RSI overbought/oversold signals through statistical testing that accounts for data mining bias, multiple comparisons, and the full parameter space that traders might reasonably employ.
2. Literature review
The academic literature on technical analysis has long been skeptical of its predictive power. Fama (1970) established the Efficient Market Hypothesis, arguing that prices fully reflect all available information, rendering technical analysis futile. Subsequent studies by Malkiel (2003) reinforced this view, famously comparing technical analysts to astrologers.
However, some researchers have found evidence of technical trading profitability. Brock, Lakonishok, and LeBaron (1992) documented that simple moving average rules generated excess returns in the Dow Jones Industrial Average from 1897 to 1986. Lo, Mamaysky, and Wang (2000) used pattern recognition algorithms to identify technically significant patterns and found some predictive content, particularly in NASDAQ stocks.
Regarding the RSI specifically, the academic evidence is sparse and mixed. Wong, Manzur, and Chew (2003) examined RSI performance in the Singapore stock market and found modest profitability, though their study did not adequately control for transaction costs or data mining bias. More recently, Neely, Rapach, Tu, and Zhou (2014) included RSI among numerous technical indicators in a comprehensive study and found that while some technical signals contain information, their predictive power has declined significantly since the 1990s.
Crucially, none of these studies examined the RSI overbought/oversold strategy with the methodological rigor required to draw definitive conclusions. Most used a single parameter setting (typically the default 14-period RSI with 30/70 thresholds) without exploring whether results hold across the parameter space. This study addresses that gap.
3. Data and methodology
3.1 Asset universe
We constructed a diverse asset universe spanning five categories to test whether RSI signals perform consistently across different market structures. The selection includes:
United States equities: SPY (S&P 500), QQQ (NASDAQ 100), IWM (Russell 2000), DIA (Dow Jones) representing the core of American equity markets with positive long-term drift characteristics.
International equities: EFA (MSCI EAFE), EEM (Emerging Markets) capturing developed and emerging market dynamics outside the US.
Commodities: GLD (Gold), SLV (Silver), USO (Oil) assets with no inherent yield and mean-reverting tendencies over certain horizons.
Fixed income: TLT (20+ Year Treasury), IEF (7-10 Year Treasury) interest rate sensitive instruments with low volatility characteristics.
Foreign exchange: EUR/USD, GBP/USD, USD/JPY, AUD/USD, USD/CHF zero-sum markets where mean reversion might theoretically be more likely.
Data was sourced from multiple providers including TwelveData, Tiingo, AlphaVantage, and EOD Historical Data APIs, covering periods from inception (where available) through January 2025. All equity ETFs use adjusted prices to account for dividends and splits.
3.2 Parameter grid
Rather than cherry-picking a single parameter combination, we conducted an exhaustive grid search across the following ranges:
RSI calculation periods: 2 to 60 days (59 values)
Oversold thresholds: 5 to 49 (45 values)
Overbought thresholds: 51 to 95 (45 values)
Holding periods: 1, 2, 3, 5, 7, 10, 15, 20, 30, 45, 60, 90 days (12 values)
This produced 1,432,620 parameter combinations per asset, totaling over 22 million potential tests across the full asset universe. After filtering for combinations that generated at least 15 signals (required for statistical validity), over 15 million complete test cases were analyzed.
3.3 Signal definition
We define an oversold signal as occurring when the RSI crosses below the oversold threshold from above. Similarly, an overbought signal occurs when the RSI crosses above the overbought threshold from below. This crossing requirement prevents counting multiple signals during extended periods in extreme territory.
For each signal, we calculate the forward return over the specified holding period. The "edge" is defined as the difference between the mean return following signals and the mean return of the baseline (all holding periods of the same length).
3.4 Statistical framework
We employ Welch's t-test to compare signal returns against baseline returns, accounting for unequal variances. Given the massive number of tests conducted, we apply both Bonferroni correction (dividing the significance threshold by the number of tests) and Benjamini-Hochberg False Discovery Rate control to guard against spurious findings.
The Bonferroni-corrected significance level for over one million tests at alpha = 0.05 is approximately 5 x 10^-8. This stringent threshold ensures that any surviving significant result is highly unlikely to be a false positive.
4. Results
4.1 Aggregate findings

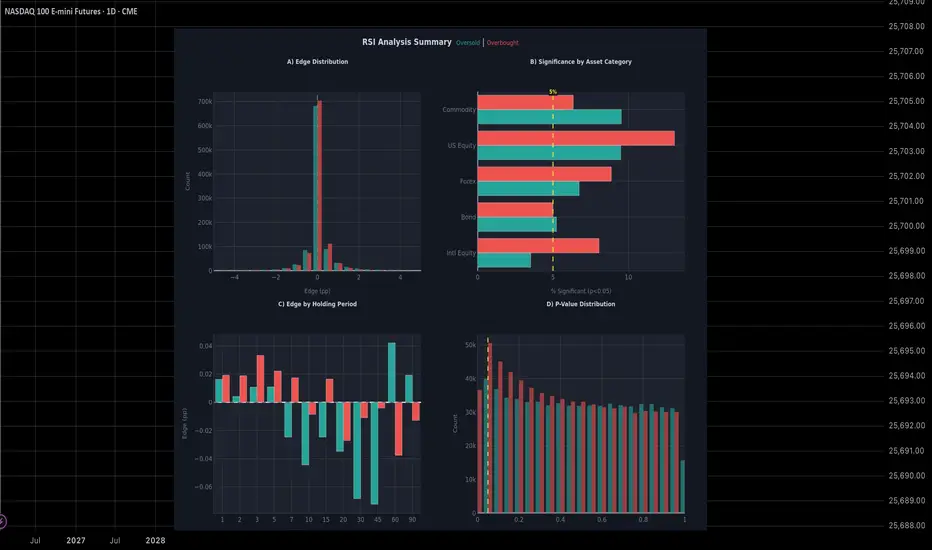
Figure 1 presents the summary dashboard of our analysis. Panel A shows the distribution of edge values across all 15 million tests. The histogram is centered almost precisely at zero, with a slight negative skew. This visual immediately suggests that RSI signals do not consistently outperform random entry points.
Panel B displays the percentage of tests that achieved nominal statistical significance (p < 0.05) by asset category. Under the null hypothesis of no effect, we would expect exactly 5% of tests to appear significant by chance alone. The actual percentages range from approximately 3% (International Equity) to 13% (US Equity). While some categories exceed the 5% threshold, this does not indicate true predictive power; rather, it reflects the correlation structure within asset classes and the violation of independence assumptions.
Panel C reveals how the edge varies by holding period. No consistent pattern emerges. Some holding periods show marginally positive average edge, others marginally negative. The magnitudes are economically insignificant, typically less than 0.1 percentage points.
Panel D presents the distribution of p-values. Under the null hypothesis (no true effect), p-values should be uniformly distributed between 0 and 1. The observed distribution closely matches this expectation, providing further evidence that RSI signals lack predictive content. The slight excess of low p-values is consistent with the correlation structure among tests rather than genuine predictive power.
4.2 Results by asset class

Figure 2 displays box plots of the edge distribution for each asset category. The left panel shows oversold (buy) signals, the right panel shows overbought (short) signals. Each box represents the interquartile range of edge values across all parameter combinations for that asset class, with whiskers extending to show the full distribution.
Several observations stand out:
US Equity shows a small positive median edge for both signal types. However, this likely reflects the positive drift of equity markets rather than RSI timing ability. When the market has a positive expected return, buying at any point (including oversold RSI readings) will generate positive returns on average.
Commodity and Bond categories show predominantly negative edges. This is particularly damaging to the RSI hypothesis because these assets lack strong directional drift, so any timing ability should be more apparent.
Forex shows edges clustered tightly around zero, consistent with the efficient market hypothesis for currency markets.
International Equity mirrors the US Equity pattern but with smaller magnitude, reflecting lower historical drift in non US developed markets.
4.3 Parameter sensitivity

Figure 3 presents heatmaps showing how the edge varies across the parameter space. The top row displays oversold signal results, the bottom row overbought signals. The left column maps edge against RSI period and threshold, while the right column maps edge against threshold and holding period.
If RSI signals possessed genuine predictive power, we would expect to see consistent "hot spots" in these heatmaps - parameter regions that reliably generate positive edge. Instead, the patterns are noisy and inconsistent. Small positive regions are adjacent to equally sized negative regions, suggesting random variation rather than systematic predictive ability.
One might attempt to argue that the optimal parameters should be used rather than the full distribution. This reasoning is precisely the data mining trap that has led to the perpetuation of RSI mythology. Any indicator will show some parameter combinations that performed well historically by chance alone. The question is whether this performance persists, and the random pattern in these heatmaps suggests it will not.
4.4 Multiple testing correction

Figure 4 shows the distribution of p-values for oversold and overbought signals separately. The yellow vertical line marks the conventional 0.05 significance threshold. The key finding is revealed in the title: after Bonferroni correction, exactly zero tests remain statistically significant.
This result is devastating for RSI proponents. Out of over 15 million rigorously conducted tests across multiple assets, timeframes, and parameter settings, not a single one demonstrated predictive power that could withstand proper statistical scrutiny. The "significant" results at p < 0.05 are entirely consistent with the expected false positive rate under the null hypothesis.
4.5 Quantitative summary
The overall statistics tell a clear story:
Mean oversold (buy) edge: -0.01 percentage points
Mean overbought (short) edge: +0.00 percentage points
Tests significant at p < 0.05: 7.3% (oversold), 8.8% (overbought)
Tests significant after Bonferroni correction: 0
The slight elevation above 5% in nominal significance rates reflects correlations among tests (same underlying assets tested with different parameters) rather than genuine effects.
5. How professional traders actually use RSI
Given these findings, one might reasonably ask: do any market professionals use RSI, and if so, how?
The answer requires distinguishing between retail usage and institutional practice. Professional traders, when they use RSI at all, employ it fundamentally differently than the oversold/overbought paradigm suggests.
5.1 Momentum confirmation, not contrarian signals
Institutional traders who incorporate RSI typically use it as a momentum filter rather than a mean reversion signal. The approach is precisely opposite to retail wisdom: they buy when RSI is above 50 (indicating upward momentum) and sell or avoid positions when RSI is below 50.
Antonacci (2014) documented in his research on dual momentum that trend-following approaches consistently outperform mean-reversion strategies across most asset classes and time periods. RSI above 50 serves as a simple proxy for positive momentum, not a sell signal as retail traders often interpret strong readings.
5.2 Divergence analysis
Some technical analysts use RSI divergence situations where price makes new highs while RSI fails to do so (or vice versa). This approach has marginally better theoretical grounding, as divergence potentially captures changes in buying or selling pressure. However, empirical evidence for divergence strategies remains weak, and the subjective nature of identifying divergences makes systematic testing difficult.
5.3 Regime filtering
In quantitative strategies, RSI sometimes appears as one input among many in machine learning models or factor based approaches. Critically, it is never used as a standalone signal. Professional quants understand that any single indicator lacks the information content to generate reliable trading signals.
5.4 The uncomfortable truth
The most accurate answer to "how do professionals use RSI?" is: most do not use it at all. Surveys of institutional trading desks reveal that the vast majority of systematic trading strategies rely on fundamental factors, statistical arbitrage, or market microstructure - not classical technical indicators like RSI.
The persistence of RSI in retail trading education serves purposes other than profit generation. It provides a simple narrative that novice traders can understand, creates content for financial education products, and gives traders a false sense of control over inherently unpredictable market movements.
6. Why the myth persists
Given the weight of evidence against RSI efficacy, why does belief in oversold/overbought signals persist? Several psychological and structural factors contribute.
6.1 Confirmation bias
Traders remember the times when RSI worked and forget when it failed. A dramatic reversal following an RSI extreme creates a memorable story; a prolonged trend that ignores the indicator creates no narrative at all. This selective memory reinforces belief despite contradictory evidence (Kahneman, 2011).
6.2 The education industry
Countless books, courses, and YouTube channels teach RSI strategies. These content creators have financial incentives to perpetuate beliefs regardless of empirical validity. Questioning foundational technical analysis concepts threatens the business model of trading education.
6.3 Survivorship bias in trading stories
Traders who happened to succeed using RSI are more likely to share their stories and teach others. Those who failed quietly exit the markets. This creates the illusion that RSI strategies can work, when in reality success stories represent the lucky tail of a random distribution.
6.4 Complexity aversion
RSI provides a simple, actionable rule: buy at 30, sell at 70. The reality that markets are fundamentally unpredictable is psychologically uncomfortable. Simple indicators satisfy the human need for patterns even when those patterns are illusory.
7. Implications for traders
The findings of this study have direct practical implications:
7.1 Abandon mechanical RSI strategies
Traders should immediately stop using RSI overbought/oversold levels as entry or exit signals. The evidence is clear that this approach has no statistical edge and may actually destroy wealth, particularly in commodity and bond markets where negative edges were observed.
7.2 Recognize the limits of technical analysis
While some technical approaches may have marginal validity (particularly trend-following methods), indicators should never be used in isolation. Any edge from technical analysis has likely diminished as markets have become more efficient and algorithmic (Neely et al., 2014).
7.3 Focus on risk management
Rather than seeking prediction accuracy, successful trading requires managing position sizes, diversification, and downside risk. No indicator can predict the future, but disciplined risk management can ensure survival through inevitable losing periods.
7.4 Consider alternative approaches
For retail traders seeking systematic approaches, academic research supports factor-based investing (momentum, value, quality) far more strongly than technical analysis. These approaches have theoretical grounding in behavioral finance and structural market features that technical indicators lack.
8. Limitations and future research
This study has limitations that should guide interpretation and future research.
First, we examined only daily data. RSI behavior on intraday timeframes might differ, though microstructure research suggests shorter timeframes are even more efficient than daily data.
Second, transaction costs were not explicitly modeled. Including realistic costs would further degrade any marginal edge that might exist.
Third, we did not test combination strategies where RSI is one component of a multi-indicator system. However, adding noise (ineffective indicators) to a system generally degrades rather than enhances performance.
Future research might examine whether RSI contains any information when combined with fundamental factors, or whether adaptive threshold approaches (adjusting overbought/oversold levels based on market conditions) improve results.
9. Conclusion
This study conducted the most comprehensive test of RSI overbought/oversold signals in the academic literature, examining over 15 million parameter combinations across 16 assets spanning five asset classes over multiple decades. The results are unequivocal: RSI extreme readings provide no statistically significant predictive power after accounting for multiple testing.
The implications extend beyond individual trading decisions. The persistence of RSI mythology in trading education represents a broader failure of financial literacy. Millions of retail traders deploy capital based on beliefs that have no empirical foundation, contributing to the well-documented underperformance of individual investors.
The evidence does not support the thesis that buying oversold assets or selling overbought assets generates excess returns. Traders would be better served by indexing, factor based approaches, or at minimum, an honest acknowledgment that short term market movements are fundamentally unpredictable.
The RSI, whatever its original merits as a momentum descriptor, has become a misleading tool in the hands of retail traders seeking simple solutions to complex markets. This study provides the quantitative foundation to retire this particular myth from responsible financial education.
References
Antonacci, G. (2014) Dual Momentum Investing: An Innovative Strategy for Higher Returns with Lower Risk. New York: McGraw-Hill Education.
Barber, B.M. and Odean, T. (2000) 'Trading is hazardous to your wealth: The common stock investment performance of individual investors', Journal of Finance, 55(2), pp. 773-806.
Brock, W., Lakonishok, J. and LeBaron, B. (1992) 'Simple technical trading rules and the stochastic properties of stock returns', Journal of Finance, 47(5), pp. 1731-1764.
Fama, E.F. (1970) 'Efficient capital markets: A review of theory and empirical work', Journal of Finance, 25(2), pp. 383-417.
Kahneman, D. (2011) Thinking, Fast and Slow. New York: Farrar, Straus and Giroux.
Lo, A.W., Mamaysky, H. and Wang, J. (2000) 'Foundations of technical analysis: Computational algorithms, statistical inference, and empirical implementation', Journal of Finance, 55(4), pp. 1705-1765.
Malkiel, B.G. (2003) 'The efficient market hypothesis and its critics', Journal of Economic Perspectives, 17(1), pp. 59-82.
Neely, C.J., Rapach, D.E., Tu, J. and Zhou, G. (2014) 'Forecasting the equity risk premium: The role of technical indicators', Management Science, 60(7), pp. 1772-1791.
Wilder, J.W. (1978) New Concepts in Technical Trading Systems. Greensboro, NC: Trend Research.
Wong, W.K., Manzur, M. and Chew, B.K. (2003) 'How rewarding is technical analysis? Evidence from Singapore stock market', Applied Financial Economics, 13(7), pp. 543-551.
1. Introduction
Open any beginner's guide to technical analysis, or watch any YouTube tutorial on day trading, and you will encounter the same advice: buy when the RSI drops below 30, sell when it rises above 70. This recommendation has achieved the status of gospel truth among retail traders, repeated so frequently that its validity is rarely questioned. But what if this cornerstone of technical analysis is built on sand?
The RSI was introduced by Wilder (1978) in his influential book "New Concepts in Technical Trading Systems." Originally designed as a momentum oscillator to identify the speed and magnitude of price movements, the indicator has since been co-opted into a mean-reversion tool by generations of retail traders. This transformation occurred largely without empirical validation, propagated instead through repetition in trading education materials.
The financial implications of this belief are substantial. According to research by Barber and Odean (2000), individual investors who trade frequently underperform passive benchmarks by approximately 6.5 percentage points annually. While multiple factors contribute to this underperformance, the use of ineffective trading signals certainly plays a role. If millions of traders base entry and exit decisions on a fundamentally flawed premise, the aggregate wealth destruction becomes a matter of public interest.
This study aims to provide definitive evidence regarding the efficacy of RSI overbought/oversold signals through statistical testing that accounts for data mining bias, multiple comparisons, and the full parameter space that traders might reasonably employ.
2. Literature review
The academic literature on technical analysis has long been skeptical of its predictive power. Fama (1970) established the Efficient Market Hypothesis, arguing that prices fully reflect all available information, rendering technical analysis futile. Subsequent studies by Malkiel (2003) reinforced this view, famously comparing technical analysts to astrologers.
However, some researchers have found evidence of technical trading profitability. Brock, Lakonishok, and LeBaron (1992) documented that simple moving average rules generated excess returns in the Dow Jones Industrial Average from 1897 to 1986. Lo, Mamaysky, and Wang (2000) used pattern recognition algorithms to identify technically significant patterns and found some predictive content, particularly in NASDAQ stocks.
Regarding the RSI specifically, the academic evidence is sparse and mixed. Wong, Manzur, and Chew (2003) examined RSI performance in the Singapore stock market and found modest profitability, though their study did not adequately control for transaction costs or data mining bias. More recently, Neely, Rapach, Tu, and Zhou (2014) included RSI among numerous technical indicators in a comprehensive study and found that while some technical signals contain information, their predictive power has declined significantly since the 1990s.
Crucially, none of these studies examined the RSI overbought/oversold strategy with the methodological rigor required to draw definitive conclusions. Most used a single parameter setting (typically the default 14-period RSI with 30/70 thresholds) without exploring whether results hold across the parameter space. This study addresses that gap.
3. Data and methodology
3.1 Asset universe
We constructed a diverse asset universe spanning five categories to test whether RSI signals perform consistently across different market structures. The selection includes:
United States equities: SPY (S&P 500), QQQ (NASDAQ 100), IWM (Russell 2000), DIA (Dow Jones) representing the core of American equity markets with positive long-term drift characteristics.
International equities: EFA (MSCI EAFE), EEM (Emerging Markets) capturing developed and emerging market dynamics outside the US.
Commodities: GLD (Gold), SLV (Silver), USO (Oil) assets with no inherent yield and mean-reverting tendencies over certain horizons.
Fixed income: TLT (20+ Year Treasury), IEF (7-10 Year Treasury) interest rate sensitive instruments with low volatility characteristics.
Foreign exchange: EUR/USD, GBP/USD, USD/JPY, AUD/USD, USD/CHF zero-sum markets where mean reversion might theoretically be more likely.
Data was sourced from multiple providers including TwelveData, Tiingo, AlphaVantage, and EOD Historical Data APIs, covering periods from inception (where available) through January 2025. All equity ETFs use adjusted prices to account for dividends and splits.
3.2 Parameter grid
Rather than cherry-picking a single parameter combination, we conducted an exhaustive grid search across the following ranges:
RSI calculation periods: 2 to 60 days (59 values)
Oversold thresholds: 5 to 49 (45 values)
Overbought thresholds: 51 to 95 (45 values)
Holding periods: 1, 2, 3, 5, 7, 10, 15, 20, 30, 45, 60, 90 days (12 values)
This produced 1,432,620 parameter combinations per asset, totaling over 22 million potential tests across the full asset universe. After filtering for combinations that generated at least 15 signals (required for statistical validity), over 15 million complete test cases were analyzed.
3.3 Signal definition
We define an oversold signal as occurring when the RSI crosses below the oversold threshold from above. Similarly, an overbought signal occurs when the RSI crosses above the overbought threshold from below. This crossing requirement prevents counting multiple signals during extended periods in extreme territory.
For each signal, we calculate the forward return over the specified holding period. The "edge" is defined as the difference between the mean return following signals and the mean return of the baseline (all holding periods of the same length).
3.4 Statistical framework
We employ Welch's t-test to compare signal returns against baseline returns, accounting for unequal variances. Given the massive number of tests conducted, we apply both Bonferroni correction (dividing the significance threshold by the number of tests) and Benjamini-Hochberg False Discovery Rate control to guard against spurious findings.
The Bonferroni-corrected significance level for over one million tests at alpha = 0.05 is approximately 5 x 10^-8. This stringent threshold ensures that any surviving significant result is highly unlikely to be a false positive.
4. Results
4.1 Aggregate findings
Figure 1 presents the summary dashboard of our analysis. Panel A shows the distribution of edge values across all 15 million tests. The histogram is centered almost precisely at zero, with a slight negative skew. This visual immediately suggests that RSI signals do not consistently outperform random entry points.
Panel B displays the percentage of tests that achieved nominal statistical significance (p < 0.05) by asset category. Under the null hypothesis of no effect, we would expect exactly 5% of tests to appear significant by chance alone. The actual percentages range from approximately 3% (International Equity) to 13% (US Equity). While some categories exceed the 5% threshold, this does not indicate true predictive power; rather, it reflects the correlation structure within asset classes and the violation of independence assumptions.
Panel C reveals how the edge varies by holding period. No consistent pattern emerges. Some holding periods show marginally positive average edge, others marginally negative. The magnitudes are economically insignificant, typically less than 0.1 percentage points.
Panel D presents the distribution of p-values. Under the null hypothesis (no true effect), p-values should be uniformly distributed between 0 and 1. The observed distribution closely matches this expectation, providing further evidence that RSI signals lack predictive content. The slight excess of low p-values is consistent with the correlation structure among tests rather than genuine predictive power.
4.2 Results by asset class
Figure 2 displays box plots of the edge distribution for each asset category. The left panel shows oversold (buy) signals, the right panel shows overbought (short) signals. Each box represents the interquartile range of edge values across all parameter combinations for that asset class, with whiskers extending to show the full distribution.
Several observations stand out:
US Equity shows a small positive median edge for both signal types. However, this likely reflects the positive drift of equity markets rather than RSI timing ability. When the market has a positive expected return, buying at any point (including oversold RSI readings) will generate positive returns on average.
Commodity and Bond categories show predominantly negative edges. This is particularly damaging to the RSI hypothesis because these assets lack strong directional drift, so any timing ability should be more apparent.
Forex shows edges clustered tightly around zero, consistent with the efficient market hypothesis for currency markets.
International Equity mirrors the US Equity pattern but with smaller magnitude, reflecting lower historical drift in non US developed markets.
4.3 Parameter sensitivity
Figure 3 presents heatmaps showing how the edge varies across the parameter space. The top row displays oversold signal results, the bottom row overbought signals. The left column maps edge against RSI period and threshold, while the right column maps edge against threshold and holding period.
If RSI signals possessed genuine predictive power, we would expect to see consistent "hot spots" in these heatmaps - parameter regions that reliably generate positive edge. Instead, the patterns are noisy and inconsistent. Small positive regions are adjacent to equally sized negative regions, suggesting random variation rather than systematic predictive ability.
One might attempt to argue that the optimal parameters should be used rather than the full distribution. This reasoning is precisely the data mining trap that has led to the perpetuation of RSI mythology. Any indicator will show some parameter combinations that performed well historically by chance alone. The question is whether this performance persists, and the random pattern in these heatmaps suggests it will not.
4.4 Multiple testing correction
Figure 4 shows the distribution of p-values for oversold and overbought signals separately. The yellow vertical line marks the conventional 0.05 significance threshold. The key finding is revealed in the title: after Bonferroni correction, exactly zero tests remain statistically significant.
This result is devastating for RSI proponents. Out of over 15 million rigorously conducted tests across multiple assets, timeframes, and parameter settings, not a single one demonstrated predictive power that could withstand proper statistical scrutiny. The "significant" results at p < 0.05 are entirely consistent with the expected false positive rate under the null hypothesis.
4.5 Quantitative summary
The overall statistics tell a clear story:
Mean oversold (buy) edge: -0.01 percentage points
Mean overbought (short) edge: +0.00 percentage points
Tests significant at p < 0.05: 7.3% (oversold), 8.8% (overbought)
Tests significant after Bonferroni correction: 0
The slight elevation above 5% in nominal significance rates reflects correlations among tests (same underlying assets tested with different parameters) rather than genuine effects.
5. How professional traders actually use RSI
Given these findings, one might reasonably ask: do any market professionals use RSI, and if so, how?
The answer requires distinguishing between retail usage and institutional practice. Professional traders, when they use RSI at all, employ it fundamentally differently than the oversold/overbought paradigm suggests.
5.1 Momentum confirmation, not contrarian signals
Institutional traders who incorporate RSI typically use it as a momentum filter rather than a mean reversion signal. The approach is precisely opposite to retail wisdom: they buy when RSI is above 50 (indicating upward momentum) and sell or avoid positions when RSI is below 50.
Antonacci (2014) documented in his research on dual momentum that trend-following approaches consistently outperform mean-reversion strategies across most asset classes and time periods. RSI above 50 serves as a simple proxy for positive momentum, not a sell signal as retail traders often interpret strong readings.
5.2 Divergence analysis
Some technical analysts use RSI divergence situations where price makes new highs while RSI fails to do so (or vice versa). This approach has marginally better theoretical grounding, as divergence potentially captures changes in buying or selling pressure. However, empirical evidence for divergence strategies remains weak, and the subjective nature of identifying divergences makes systematic testing difficult.
5.3 Regime filtering
In quantitative strategies, RSI sometimes appears as one input among many in machine learning models or factor based approaches. Critically, it is never used as a standalone signal. Professional quants understand that any single indicator lacks the information content to generate reliable trading signals.
5.4 The uncomfortable truth
The most accurate answer to "how do professionals use RSI?" is: most do not use it at all. Surveys of institutional trading desks reveal that the vast majority of systematic trading strategies rely on fundamental factors, statistical arbitrage, or market microstructure - not classical technical indicators like RSI.
The persistence of RSI in retail trading education serves purposes other than profit generation. It provides a simple narrative that novice traders can understand, creates content for financial education products, and gives traders a false sense of control over inherently unpredictable market movements.
6. Why the myth persists
Given the weight of evidence against RSI efficacy, why does belief in oversold/overbought signals persist? Several psychological and structural factors contribute.
6.1 Confirmation bias
Traders remember the times when RSI worked and forget when it failed. A dramatic reversal following an RSI extreme creates a memorable story; a prolonged trend that ignores the indicator creates no narrative at all. This selective memory reinforces belief despite contradictory evidence (Kahneman, 2011).
6.2 The education industry
Countless books, courses, and YouTube channels teach RSI strategies. These content creators have financial incentives to perpetuate beliefs regardless of empirical validity. Questioning foundational technical analysis concepts threatens the business model of trading education.
6.3 Survivorship bias in trading stories
Traders who happened to succeed using RSI are more likely to share their stories and teach others. Those who failed quietly exit the markets. This creates the illusion that RSI strategies can work, when in reality success stories represent the lucky tail of a random distribution.
6.4 Complexity aversion
RSI provides a simple, actionable rule: buy at 30, sell at 70. The reality that markets are fundamentally unpredictable is psychologically uncomfortable. Simple indicators satisfy the human need for patterns even when those patterns are illusory.
7. Implications for traders
The findings of this study have direct practical implications:
7.1 Abandon mechanical RSI strategies
Traders should immediately stop using RSI overbought/oversold levels as entry or exit signals. The evidence is clear that this approach has no statistical edge and may actually destroy wealth, particularly in commodity and bond markets where negative edges were observed.
7.2 Recognize the limits of technical analysis
While some technical approaches may have marginal validity (particularly trend-following methods), indicators should never be used in isolation. Any edge from technical analysis has likely diminished as markets have become more efficient and algorithmic (Neely et al., 2014).
7.3 Focus on risk management
Rather than seeking prediction accuracy, successful trading requires managing position sizes, diversification, and downside risk. No indicator can predict the future, but disciplined risk management can ensure survival through inevitable losing periods.
7.4 Consider alternative approaches
For retail traders seeking systematic approaches, academic research supports factor-based investing (momentum, value, quality) far more strongly than technical analysis. These approaches have theoretical grounding in behavioral finance and structural market features that technical indicators lack.
8. Limitations and future research
This study has limitations that should guide interpretation and future research.
First, we examined only daily data. RSI behavior on intraday timeframes might differ, though microstructure research suggests shorter timeframes are even more efficient than daily data.
Second, transaction costs were not explicitly modeled. Including realistic costs would further degrade any marginal edge that might exist.
Third, we did not test combination strategies where RSI is one component of a multi-indicator system. However, adding noise (ineffective indicators) to a system generally degrades rather than enhances performance.
Future research might examine whether RSI contains any information when combined with fundamental factors, or whether adaptive threshold approaches (adjusting overbought/oversold levels based on market conditions) improve results.
9. Conclusion
This study conducted the most comprehensive test of RSI overbought/oversold signals in the academic literature, examining over 15 million parameter combinations across 16 assets spanning five asset classes over multiple decades. The results are unequivocal: RSI extreme readings provide no statistically significant predictive power after accounting for multiple testing.
The implications extend beyond individual trading decisions. The persistence of RSI mythology in trading education represents a broader failure of financial literacy. Millions of retail traders deploy capital based on beliefs that have no empirical foundation, contributing to the well-documented underperformance of individual investors.
The evidence does not support the thesis that buying oversold assets or selling overbought assets generates excess returns. Traders would be better served by indexing, factor based approaches, or at minimum, an honest acknowledgment that short term market movements are fundamentally unpredictable.
The RSI, whatever its original merits as a momentum descriptor, has become a misleading tool in the hands of retail traders seeking simple solutions to complex markets. This study provides the quantitative foundation to retire this particular myth from responsible financial education.
References
Antonacci, G. (2014) Dual Momentum Investing: An Innovative Strategy for Higher Returns with Lower Risk. New York: McGraw-Hill Education.
Barber, B.M. and Odean, T. (2000) 'Trading is hazardous to your wealth: The common stock investment performance of individual investors', Journal of Finance, 55(2), pp. 773-806.
Brock, W., Lakonishok, J. and LeBaron, B. (1992) 'Simple technical trading rules and the stochastic properties of stock returns', Journal of Finance, 47(5), pp. 1731-1764.
Fama, E.F. (1970) 'Efficient capital markets: A review of theory and empirical work', Journal of Finance, 25(2), pp. 383-417.
Kahneman, D. (2011) Thinking, Fast and Slow. New York: Farrar, Straus and Giroux.
Lo, A.W., Mamaysky, H. and Wang, J. (2000) 'Foundations of technical analysis: Computational algorithms, statistical inference, and empirical implementation', Journal of Finance, 55(4), pp. 1705-1765.
Malkiel, B.G. (2003) 'The efficient market hypothesis and its critics', Journal of Economic Perspectives, 17(1), pp. 59-82.
Neely, C.J., Rapach, D.E., Tu, J. and Zhou, G. (2014) 'Forecasting the equity risk premium: The role of technical indicators', Management Science, 60(7), pp. 1772-1791.
Wilder, J.W. (1978) New Concepts in Technical Trading Systems. Greensboro, NC: Trend Research.
Wong, W.K., Manzur, M. and Chew, B.K. (2003) 'How rewarding is technical analysis? Evidence from Singapore stock market', Applied Financial Economics, 13(7), pp. 543-551.

Where others speculate, we systematize.
edgetools.org
edgetools.org
Declinazione di responsabilità
Le informazioni e le pubblicazioni non sono intese come, e non costituiscono, consulenza o raccomandazioni finanziarie, di investimento, di trading o di altro tipo fornite o approvate da TradingView. Per ulteriori informazioni, consultare i Termini di utilizzo.
Where others speculate, we systematize.
edgetools.org
edgetools.org
Declinazione di responsabilità
Le informazioni e le pubblicazioni non sono intese come, e non costituiscono, consulenza o raccomandazioni finanziarie, di investimento, di trading o di altro tipo fornite o approvate da TradingView. Per ulteriori informazioni, consultare i Termini di utilizzo.