
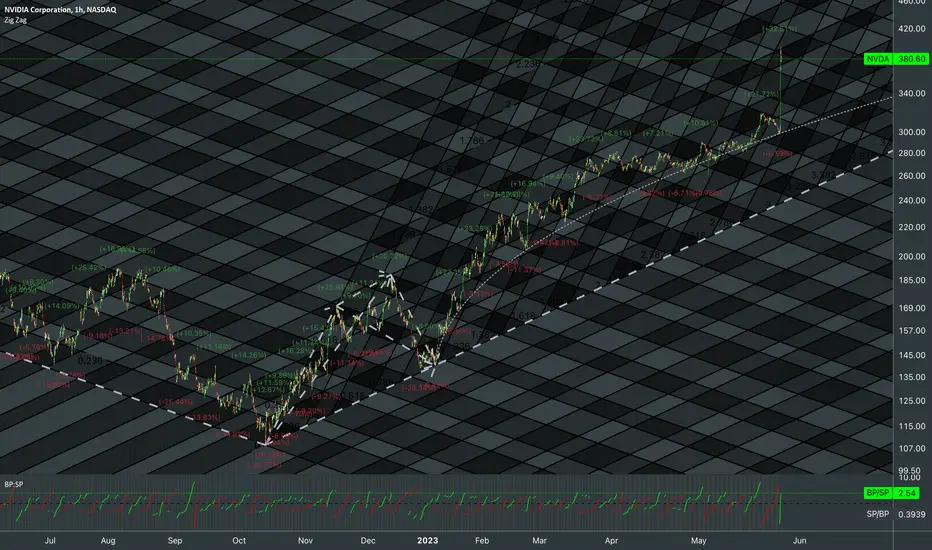
Relationship between ATH, Local bottom and first pullback in fibonacci ratio lines. Testing Buying Pressure / Selling Pressure volatility based indicator of measuring relationship between metrics of green and red candles separately. That's why there is 1 dashed line to indicate when they balance. Red line is SP / BP to see ongoing change in sellers' aspect.

Left part of the chart:

Left part of the chart:

🜲
Declinazione di responsabilità
Le informazioni e le pubblicazioni non sono intese come, e non costituiscono, consulenza o raccomandazioni finanziarie, di investimento, di trading o di altro tipo fornite o approvate da TradingView. Per ulteriori informazioni, consultare i Termini di utilizzo.
Declinazione di responsabilità
Le informazioni e le pubblicazioni non sono intese come, e non costituiscono, consulenza o raccomandazioni finanziarie, di investimento, di trading o di altro tipo fornite o approvate da TradingView. Per ulteriori informazioni, consultare i Termini di utilizzo.