
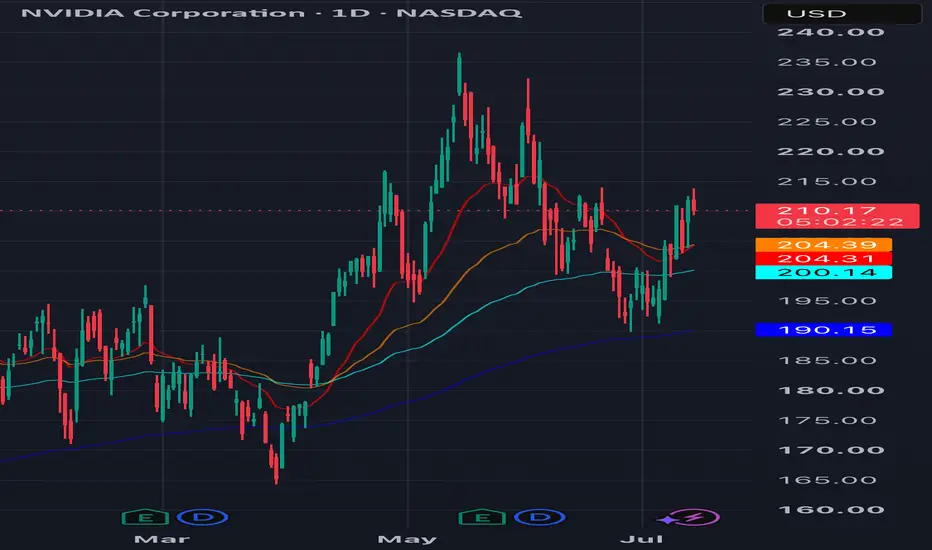
This analysis focuses strictly on EMA behavior to understand NVDA’s current positioning within the broader trend.
Following the March 2026 market downturn, NVDA established a clear pattern around its EMAs:
* Strong moves above key EMAs → Expansion phases (outperformance)
* Pullbacks toward / below EMAs → Compression phases (relative weakness)
What stands out is the cyclical interaction with the EMAs:
1. Price reclaims and holds above EMAs → momentum builds
2. Price extends → trend strengthens
3. Price pulls back toward EMAs → temporary weakness
4. Reclaim → continuation higher
We are currently in a pullback phase near key EMAs, where price is consolidating after a prior expansion.
Historically, this type of EMA compression within an uptrend has acted as a reset before continuation, rather than a full trend reversal.
📌 Key read:
* Trend structure remains intact while EMAs are respected
* Pullbacks into EMAs can signal positioning zones, not necessarily exits
* The next move depends on whether price holds and reclaims these levels
This is a trend-following framework, not a prediction tool — it helps identify where momentum is cooling vs expanding.
⸻
⚠️ Disclaimer: This analysis is for educational purposes only and does not constitute financial advice. Always do your own research before making investment decisions.
Following the March 2026 market downturn, NVDA established a clear pattern around its EMAs:
* Strong moves above key EMAs → Expansion phases (outperformance)
* Pullbacks toward / below EMAs → Compression phases (relative weakness)
What stands out is the cyclical interaction with the EMAs:
1. Price reclaims and holds above EMAs → momentum builds
2. Price extends → trend strengthens
3. Price pulls back toward EMAs → temporary weakness
4. Reclaim → continuation higher
We are currently in a pullback phase near key EMAs, where price is consolidating after a prior expansion.
Historically, this type of EMA compression within an uptrend has acted as a reset before continuation, rather than a full trend reversal.
📌 Key read:
* Trend structure remains intact while EMAs are respected
* Pullbacks into EMAs can signal positioning zones, not necessarily exits
* The next move depends on whether price holds and reclaims these levels
This is a trend-following framework, not a prediction tool — it helps identify where momentum is cooling vs expanding.
⸻
⚠️ Disclaimer: This analysis is for educational purposes only and does not constitute financial advice. Always do your own research before making investment decisions.

Declinazione di responsabilità
Le informazioni e le pubblicazioni non sono intese come, e non costituiscono, consulenza o raccomandazioni finanziarie, di investimento, di trading o di altro tipo fornite o approvate da TradingView. Per ulteriori informazioni, consultare i Termini di utilizzo.
Declinazione di responsabilità
Le informazioni e le pubblicazioni non sono intese come, e non costituiscono, consulenza o raccomandazioni finanziarie, di investimento, di trading o di altro tipo fornite o approvate da TradingView. Per ulteriori informazioni, consultare i Termini di utilizzo.