
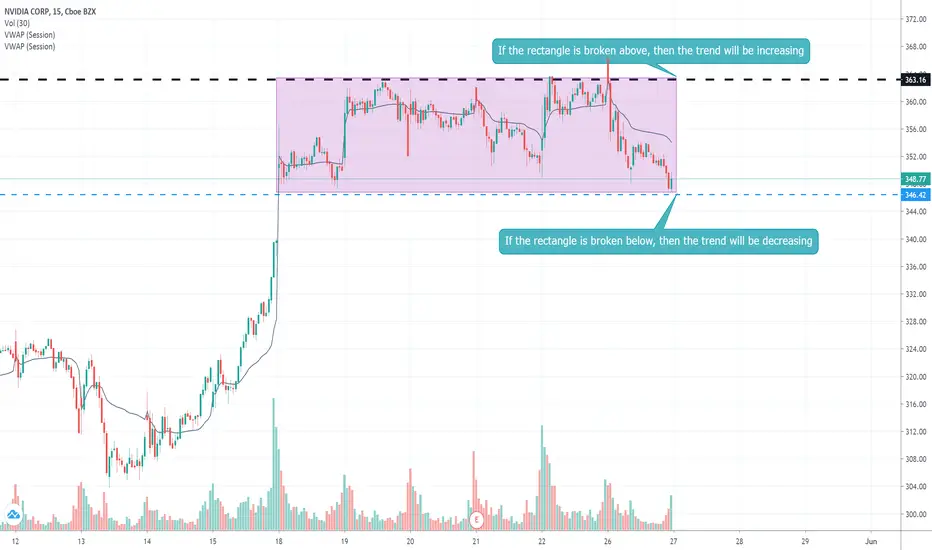
As shown in the graph, it seems there is an equilibrium during a certain period (Period specified by the rectangle.
Any huge break of this rectangle gives an idea about the trend of the stock price. if it breaks it down, the stock has a good chance to b decreasing, however, if it an up break, the stock will be increasing.
If none of these cases were realized, the NVIDIA stock will continue its equilibrium.
Any huge break of this rectangle gives an idea about the trend of the stock price. if it breaks it down, the stock has a good chance to b decreasing, however, if it an up break, the stock will be increasing.
If none of these cases were realized, the NVIDIA stock will continue its equilibrium.

Declinazione di responsabilità
Le informazioni e le pubblicazioni non sono intese come, e non costituiscono, consulenza o raccomandazioni finanziarie, di investimento, di trading o di altro tipo fornite o approvate da TradingView. Per ulteriori informazioni, consultare i Termini di utilizzo.
Declinazione di responsabilità
Le informazioni e le pubblicazioni non sono intese come, e non costituiscono, consulenza o raccomandazioni finanziarie, di investimento, di trading o di altro tipo fornite o approvate da TradingView. Per ulteriori informazioni, consultare i Termini di utilizzo.