
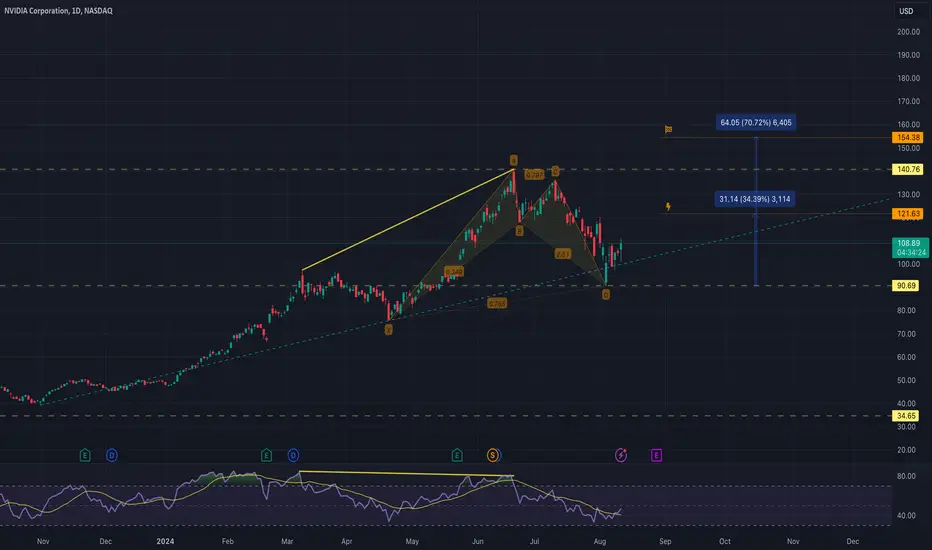
#Nvda 1D chart;
Continues its 8-month steady rise from the beginning of the year to today
It had given the first bearish signal with its divergence in the $140 zone, which is the Ath level.
As of the $90 level, the bullish pattern started and the target points are as in the chart.
Continues its 8-month steady rise from the beginning of the year to today
It had given the first bearish signal with its divergence in the $140 zone, which is the Ath level.
As of the $90 level, the bullish pattern started and the target points are as in the chart.

For more you can follow me on X. @UgurTash
Declinazione di responsabilità
Le informazioni e le pubblicazioni non sono intese come, e non costituiscono, consulenza o raccomandazioni finanziarie, di investimento, di trading o di altro tipo fornite o approvate da TradingView. Per ulteriori informazioni, consultare i Termini di utilizzo.
For more you can follow me on X. @UgurTash
Declinazione di responsabilità
Le informazioni e le pubblicazioni non sono intese come, e non costituiscono, consulenza o raccomandazioni finanziarie, di investimento, di trading o di altro tipo fornite o approvate da TradingView. Per ulteriori informazioni, consultare i Termini di utilizzo.