
📊 Macro Overview & Structural Context
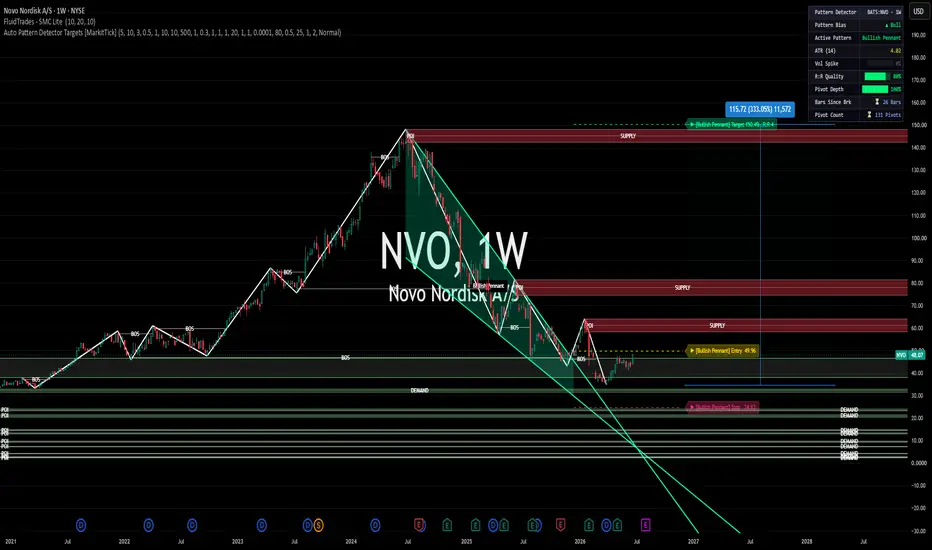
Looking at the NVO weekly chart, price action is currently compressing inside a massive, long-term Bullish Pennant pattern that has been forming since mid-2024. Following a powerful multi-year impulse wave, this extended correction has allowed the stock to fully reset its technical indicators and mitigate deep structural liquidity pools.
🔍 Key Technical Observations
SMC Demand Mitigation: The FluidTrades SMC indicator reveals that price is actively reacting out of a major macro Demand Zone / Order Block located between the $40 – $48 region.
Liquidity Sweeps: Recent lower timeframe wick action indicates a sweep of internal sell-side liquidity, followed by solid structural absorption from macro buyers defending this key structural floor.
The Reversal Apex: Price is reaching the absolute apex of the converging trendlines. A definitive breakout line sits near $49.96, which would mark a clean weekly Change of Character (CHoCH) to confirm the macro correction is complete.
🎯 Long-Term Target Projection
Entry Trigger: A clean daily or weekly candle close above $49.96.
Invalidation / Stop Loss: A macro breakdown below structural demand at $24.83.
Ultimate Target: $150.49 (Representing a projected measured move of the pennant structure if institutional momentum completely returns).
⚠️ Disclaimer: This analysis is based strictly on algorithmic structural models for educational purposes and does not constitute financial advice. Always manage your position sizing according to your personal risk tolerances.
Looking at the NVO weekly chart, price action is currently compressing inside a massive, long-term Bullish Pennant pattern that has been forming since mid-2024. Following a powerful multi-year impulse wave, this extended correction has allowed the stock to fully reset its technical indicators and mitigate deep structural liquidity pools.
🔍 Key Technical Observations
SMC Demand Mitigation: The FluidTrades SMC indicator reveals that price is actively reacting out of a major macro Demand Zone / Order Block located between the $40 – $48 region.
Liquidity Sweeps: Recent lower timeframe wick action indicates a sweep of internal sell-side liquidity, followed by solid structural absorption from macro buyers defending this key structural floor.
The Reversal Apex: Price is reaching the absolute apex of the converging trendlines. A definitive breakout line sits near $49.96, which would mark a clean weekly Change of Character (CHoCH) to confirm the macro correction is complete.
🎯 Long-Term Target Projection
Entry Trigger: A clean daily or weekly candle close above $49.96.
Invalidation / Stop Loss: A macro breakdown below structural demand at $24.83.
Ultimate Target: $150.49 (Representing a projected measured move of the pennant structure if institutional momentum completely returns).
⚠️ Disclaimer: This analysis is based strictly on algorithmic structural models for educational purposes and does not constitute financial advice. Always manage your position sizing according to your personal risk tolerances.

Declinazione di responsabilità
Le informazioni e le pubblicazioni non sono intese come, e non costituiscono, consulenza o raccomandazioni finanziarie, di investimento, di trading o di altro tipo fornite o approvate da TradingView. Per ulteriori informazioni, consultare i Termini di utilizzo.
Declinazione di responsabilità
Le informazioni e le pubblicazioni non sono intese come, e non costituiscono, consulenza o raccomandazioni finanziarie, di investimento, di trading o di altro tipo fornite o approvate da TradingView. Per ulteriori informazioni, consultare i Termini di utilizzo.