
OFSS: Volatility Coiling for an Imminent 1,938-Point Move!
🔥 OFSS: Volatility Coiling for an Imminent 1,938-Point Move! 🚀
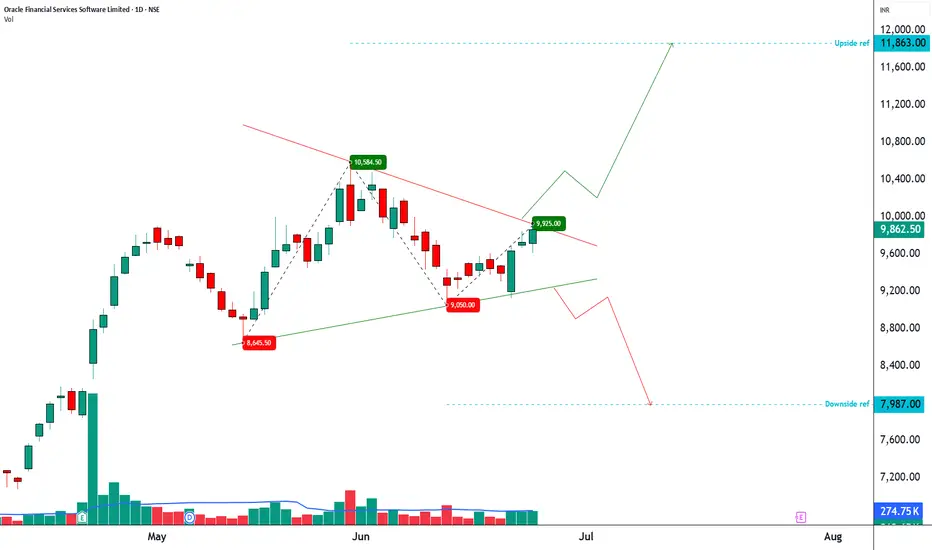
Oracle Financial Services Software Limited (OFSS) is currently trading at a critical decision point as price compresses into the apex of a well-defined Symmetrical Triangle. With volatility steadily contracting and structure tightening around Pivot D, the market appears to be storing energy for a directional move that could exceed 1,900 points.
________________________________________
📐 Pattern Structure: Symmetrical Triangle
The current formation reflects a classic battle between buyers and sellers:
Pivot A (Base Low): 8,646.50
Pivot B (Base High): 10,584.50
Pivot C (Higher Low): 9,050.00
Pivot D (Lower High / Current Level): 9,925.00
This sequence of higher lows and lower highs has produced a textbook Symmetrical Triangle, a pattern known for generating powerful expansion phases once compression reaches its final stages.
Pattern Metrics
Implied Pattern Height: 1,938.00 points
Upside Ref: 11,863.00(as per pattern metrics)
Downside Ref: 7,987.00(as per pattern metrics)
The key takeaway is simple: the longer the compression persists, the more meaningful the eventual breakout tends to become.
________________________________________
📉 Volatility Profile
One of the strongest confirmations of this setup is the behavior of volume.
Throughout the May–June consolidation phase, participation has gradually diminished, producing a clear contraction in traded volume. This decline in activity is precisely what technicians expect to see during the development of a healthy Symmetrical Triangle.
Lower volume during consolidation followed by volume expansion at breakout often marks the transition from accumulation/distribution into trend continuation.
________________________________________________________________________________
🎯 Execution Triggers
Scenario Trigger Confirmation Projection
Upside Ref Daily Close above 9,925.00 Volume ≥ 2x recent average 11,863.00
Downside Ref Daily Close below 9,050.00 Strong volume expansion 7,987.00
________________________________________________________________________________
Patience is critical. Premature entries inside the triangle often result in whipsaws as price continues to oscillate within the contracting structure.
________________________________________
⚠️ Risk Management & Invalidation
For Bullish Participants
Entry only after a confirmed daily close above 9,925.00
Initial protective stop below 9,050.00
Conservative traders may trail stops as new swing lows develop after breakout
For Bearish Participants
Entry only after a confirmed daily close below 9,050.00
Protective stop above 9,925.00
Avoid initiating shorts while price remains trapped within the triangle
The most important rule here is respecting the boundaries of the structure. Until either Pivot C or Pivot D is decisively breached, OFSS remains in compression mode.
________________________________________
📊 Technical Perspective
Symmetrical Triangles are neutral by nature—they do not predict direction, they predict expansion.
At present, OFSS is approaching the latter stages of its consolidation cycle. The narrowing price range, declining volatility, and fading volume profile collectively suggest that a significant directional move may be approaching.
The market is essentially advertising one message:
A large move is likely coming. The only missing piece is direction.
________________________________________
💬 Community Discussion
Are you accumulation-heavy here or waiting for the 9,925 breakout trigger before committing capital?
Let me know your view below.
Disclaimer:
This analysis is shared purely for educational and informational purposes and should not be considered investment advice, research advice, or a recommendation to buy, sell, or hold any security. The chart patterns, price levels, targets, and technical observations discussed are based on historical price action and market structure, which may change without notice. Markets involve risk, and all trading and investment decisions should be made after conducting your own research and assessing your risk tolerance. Past performance is not indicative of future results.

STWP | Mentor & Demand-Supply Specialist |
Empowering traders through structured learning |
simpletradewithpatience.com
chat.whatsapp.com/CpgyHCfioQ5Hxf7rd8pDqw
wa.me/message/6IOPHGOXMGZ4N1
Educational Only
Empowering traders through structured learning |
simpletradewithpatience.com
chat.whatsapp.com/CpgyHCfioQ5Hxf7rd8pDqw
wa.me/message/6IOPHGOXMGZ4N1
Educational Only
Declinazione di responsabilità
Le informazioni e le pubblicazioni non sono intese come, e non costituiscono, consulenza o raccomandazioni finanziarie, di investimento, di trading o di altro tipo fornite o approvate da TradingView. Per ulteriori informazioni, consultare i Termini di utilizzo.