
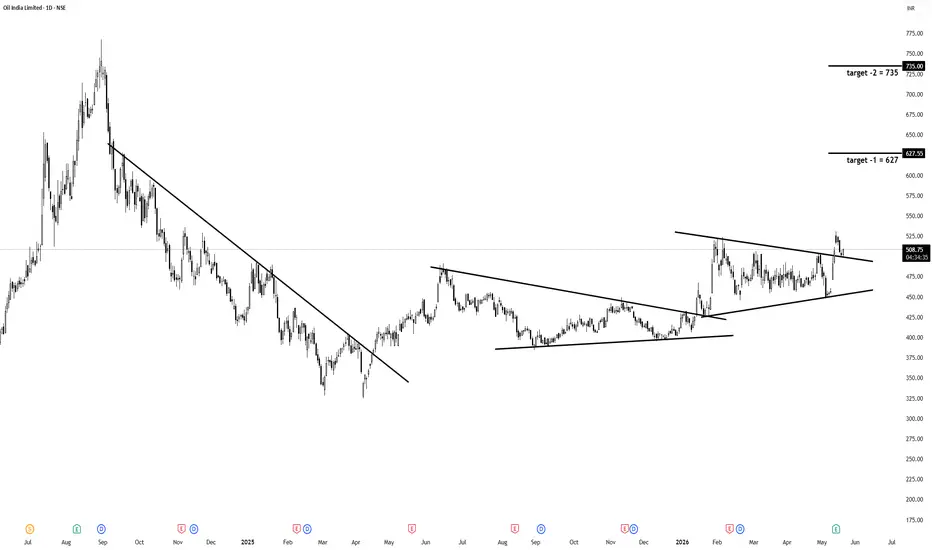
OIL INDIA – Daily Timeframe Breakout Setup
Oil India Limited is showing a strong symmetrical triangle breakout setup on the daily timeframe after several months of consolidation. Price action has been compressing between descending resistance and rising support, indicating accumulation before expansion.
The recent bullish candle has pushed price above the upper trendline resistance near the 500 zone, signaling a potential breakout from the consolidation structure. This breakout comes after multiple rejections from the resistance trendline, making the move technically significant.
Technical Structure
Pattern: Symmetrical Triangle / Volatility Compression
Timeframe: Daily
Breakout Zone: Around 500–510
Current Price: Near 509
Volume Confirmation: A sustained rise in volume above breakout zone would confirm bullish continuation
Trend Bias: Bullish above breakout trendline
Why This Setup Looks Strong
Long Consolidation Phase
Price spent several months moving sideways within narrowing boundaries.
Such consolidations generally lead to powerful directional moves once breakout happens.
Higher Lows Formation
Buyers consistently defended rising support levels.
Indicates gradual accumulation and strengthening demand.
Resistance Breakout
Price has now crossed the descending resistance trendline.
This shifts short-term market structure from neutral to bullish.
Momentum Expansion
Strong bullish candle after compression suggests momentum expansion phase may begin.
Important Levels
Immediate Resistance: 520–525
Breakout Confirmation Zone: Sustaining above 500
Support Zone: 485–490
Major Support: Rising trendline near 460
Targets
Target 1: 627
Target 2: 735
These targets are derived from the broader range expansion and measured move projection from the triangle breakout.
Risk Management
Conservative traders can wait for:
Daily candle close above breakout zone
Volume confirmation
Successful retest of trendline as support
Suggested Stop Loss: Below 485 on closing basis
Trading View Caption Version
OIL INDIA Daily Breakout Setup 📈
After months of consolidation inside a symmetrical triangle, OIL INDIA has finally attempted a breakout above descending resistance near 500 levels.
The structure shows:
✔ Higher lows formation
✔ Compression breakout
✔ Bullish momentum candle
✔ Possible start of expansion move
As long as price sustains above the breakout zone, the chart remains bullish for higher targets.
🎯 Targets: 627 / 735
🛑 SL: Below 485 daily closing basis
A successful retest and volume expansion can further strengthen the breakout confirmation.
Oil India Limited is showing a strong symmetrical triangle breakout setup on the daily timeframe after several months of consolidation. Price action has been compressing between descending resistance and rising support, indicating accumulation before expansion.
The recent bullish candle has pushed price above the upper trendline resistance near the 500 zone, signaling a potential breakout from the consolidation structure. This breakout comes after multiple rejections from the resistance trendline, making the move technically significant.
Technical Structure
Pattern: Symmetrical Triangle / Volatility Compression
Timeframe: Daily
Breakout Zone: Around 500–510
Current Price: Near 509
Volume Confirmation: A sustained rise in volume above breakout zone would confirm bullish continuation
Trend Bias: Bullish above breakout trendline
Why This Setup Looks Strong
Long Consolidation Phase
Price spent several months moving sideways within narrowing boundaries.
Such consolidations generally lead to powerful directional moves once breakout happens.
Higher Lows Formation
Buyers consistently defended rising support levels.
Indicates gradual accumulation and strengthening demand.
Resistance Breakout
Price has now crossed the descending resistance trendline.
This shifts short-term market structure from neutral to bullish.
Momentum Expansion
Strong bullish candle after compression suggests momentum expansion phase may begin.
Important Levels
Immediate Resistance: 520–525
Breakout Confirmation Zone: Sustaining above 500
Support Zone: 485–490
Major Support: Rising trendline near 460
Targets
Target 1: 627
Target 2: 735
These targets are derived from the broader range expansion and measured move projection from the triangle breakout.
Risk Management
Conservative traders can wait for:
Daily candle close above breakout zone
Volume confirmation
Successful retest of trendline as support
Suggested Stop Loss: Below 485 on closing basis
Trading View Caption Version
OIL INDIA Daily Breakout Setup 📈
After months of consolidation inside a symmetrical triangle, OIL INDIA has finally attempted a breakout above descending resistance near 500 levels.
The structure shows:
✔ Higher lows formation
✔ Compression breakout
✔ Bullish momentum candle
✔ Possible start of expansion move
As long as price sustains above the breakout zone, the chart remains bullish for higher targets.
🎯 Targets: 627 / 735
🛑 SL: Below 485 daily closing basis
A successful retest and volume expansion can further strengthen the breakout confirmation.
Nota
closeup view of daily chart
Nota
in.tradingview.com/symbols/NSE-OIL/financials-earnings/?earnings-period=FY&revenues-period=FYcheck earnings of this stock
Nota
100% stop loss triggered Trade chiuso: stop raggiunto

Pubblicazioni correlate
Declinazione di responsabilità
Le informazioni e le pubblicazioni non sono intese come, e non costituiscono, consulenza o raccomandazioni finanziarie, di investimento, di trading o di altro tipo fornite o approvate da TradingView. Per ulteriori informazioni, consultare i Termini di utilizzo.
Pubblicazioni correlate
Declinazione di responsabilità
Le informazioni e le pubblicazioni non sono intese come, e non costituiscono, consulenza o raccomandazioni finanziarie, di investimento, di trading o di altro tipo fornite o approvate da TradingView. Per ulteriori informazioni, consultare i Termini di utilizzo.