
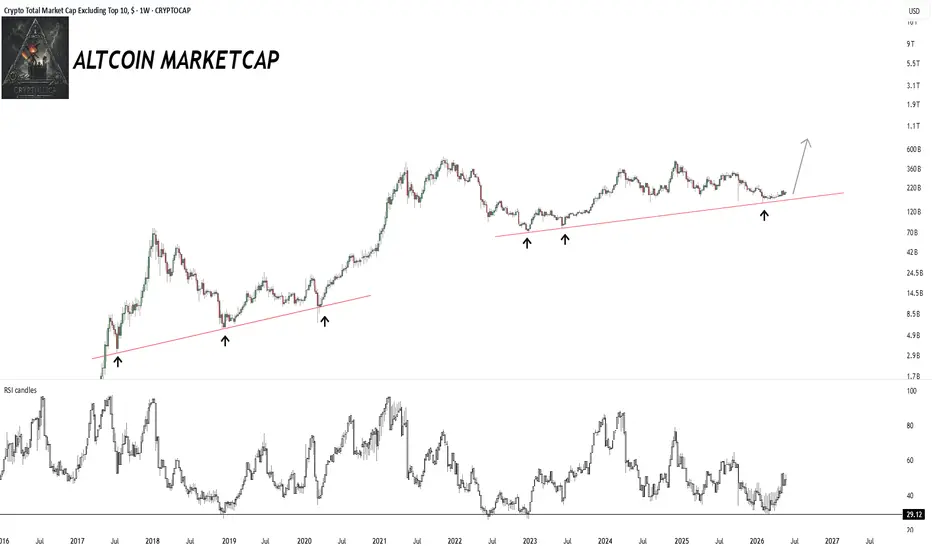
ALTCOIN MARKETCAP EXCLUDING TOP 10 /OTHERS MARKETCAP 1w
The broader risk curve is still alive.
This chart is important because it removes the largest assets from the equation and focuses on the deeper altcoin market. In other words, this is not Bitcoin, Ethereum or the dominant top names carrying the structure. This is the part of the market that usually tells us whether capital is truly willing to move further out on the risk curve.
The main message is constructive. The market has returned to the rising weekly support structure and reacted from it again. This same type of support behavior mattered in previous accumulation and rebuild phases. The important point is not that the market is already in full expansion. It is that the broader altcoin structure did not break after a long correction.
This is usually how early rotation structures look. They do not begin with excitement. They begin with compression, weak sentiment, low attention and repeated support defense. The chart is now showing that exact combination.
The RSI also supports the same reading. Momentum reset back toward the lower zone and is now recovering toward the neutral area. That is not a late-cycle euphoria profile. It is closer to a rebuild profile. Previous strong altcoin phases were not born when RSI was already overheated. They were born after the market defended structure and momentum started turning up from low levels.
This does not mean every altcoin will move at the same time. It does not mean the entire market is confirmed. But it does mean the broader altcoin basket is still structurally alive. The market is holding the area it needed to hold, and the risk curve is beginning to look more interesting again.
The next step is follow-through. If this index continues to hold above the rising support and starts reclaiming the previous resistance clusters, the message becomes stronger. That would suggest the market is moving from repair into expansion attempt. The more important signal would be breadth: not one or two coins moving, but broader participation across mid-cap and high-beta structures.
For now, my reading is simple. The broader altcoin market excluding the top 10 is not showing final exhaustion. It is showing a long-term support retest, RSI recovery from a reset zone and early signs of renewed risk appetite.
This is not the obvious phase yet. That is why it matters.
Altseason is not only about individual coin pumps. It is a risk curve. And this chart shows that the deeper part of the risk curve is still building above a major structural base.
If the market continues to hold here, the next expansion attempt can become much more important.
OTHERS DOMINANCE

ALTCOIN DOMINANCE AGAINST BITCOIN
The previous chart showed that the broader altcoin market excluding the top 10 is still holding its long-term USD structure. This chart adds the more important question:
Can the deeper altcoin market start outperforming Bitcoin?
That is the real altseason test.
This ratio measures the total market cap excluding the top 10 against BTC. It is not about one coin. It is not about a few strong narratives. It shows whether capital is moving deeper into the risk curve beyond Bitcoin and the largest crypto assets.
The structure is very clear. In 2017 and 2021, strong altseason phases appeared when this ratio expanded aggressively against Bitcoin. Those were the periods where the broader altcoin market was not only rising in USD terms, but actually outperforming BTC.
Since the 2021 cycle top, the ratio has been compressed under a long descending structure. That means Bitcoin has dominated the deeper altcoin market for years. This is why the last few years felt so frustrating for many altcoin investors. Some coins bounced, some narratives appeared, but the broad relative structure against BTC remained weak.
Now the chart is sitting near the lower part of the long-term range again. This is the same type of area where previous major bottom structures formed. The market is not euphoric here. It is compressed, ignored and sitting close to the zone where altcoin risk historically begins to matter again.
The important part is that price is now reaching the point where the lower range support and the descending resistance are coming together. This is a decision zone.
If this ratio breaks upward from the descending structure, the message becomes much stronger. It would suggest that the broader altcoin market is no longer only surviving against Bitcoin. It is starting to rotate.
That is when the altseason thesis becomes more serious.
Until then, this is still a setup, not a confirmed expansion. But the structure is getting late. The ratio is near the bottom of the range, sentiment toward altcoins is still weak, and the market is close to a major relative-strength decision.
The key idea is simple:
Altseason is not confirmed by altcoins rising in USD.
It is confirmed when altcoins begin outperforming Bitcoin.
This chart is where that question becomes visible.
The broader altcoin market is still compressed against BTC, but it is now sitting in the area where the next major rotation attempt can begin.
The broader risk curve is still alive.
This chart is important because it removes the largest assets from the equation and focuses on the deeper altcoin market. In other words, this is not Bitcoin, Ethereum or the dominant top names carrying the structure. This is the part of the market that usually tells us whether capital is truly willing to move further out on the risk curve.
The main message is constructive. The market has returned to the rising weekly support structure and reacted from it again. This same type of support behavior mattered in previous accumulation and rebuild phases. The important point is not that the market is already in full expansion. It is that the broader altcoin structure did not break after a long correction.
This is usually how early rotation structures look. They do not begin with excitement. They begin with compression, weak sentiment, low attention and repeated support defense. The chart is now showing that exact combination.
The RSI also supports the same reading. Momentum reset back toward the lower zone and is now recovering toward the neutral area. That is not a late-cycle euphoria profile. It is closer to a rebuild profile. Previous strong altcoin phases were not born when RSI was already overheated. They were born after the market defended structure and momentum started turning up from low levels.
This does not mean every altcoin will move at the same time. It does not mean the entire market is confirmed. But it does mean the broader altcoin basket is still structurally alive. The market is holding the area it needed to hold, and the risk curve is beginning to look more interesting again.
The next step is follow-through. If this index continues to hold above the rising support and starts reclaiming the previous resistance clusters, the message becomes stronger. That would suggest the market is moving from repair into expansion attempt. The more important signal would be breadth: not one or two coins moving, but broader participation across mid-cap and high-beta structures.
For now, my reading is simple. The broader altcoin market excluding the top 10 is not showing final exhaustion. It is showing a long-term support retest, RSI recovery from a reset zone and early signs of renewed risk appetite.
This is not the obvious phase yet. That is why it matters.
Altseason is not only about individual coin pumps. It is a risk curve. And this chart shows that the deeper part of the risk curve is still building above a major structural base.
If the market continues to hold here, the next expansion attempt can become much more important.
OTHERS DOMINANCE
ALTCOIN DOMINANCE AGAINST BITCOIN
The previous chart showed that the broader altcoin market excluding the top 10 is still holding its long-term USD structure. This chart adds the more important question:
Can the deeper altcoin market start outperforming Bitcoin?
That is the real altseason test.
This ratio measures the total market cap excluding the top 10 against BTC. It is not about one coin. It is not about a few strong narratives. It shows whether capital is moving deeper into the risk curve beyond Bitcoin and the largest crypto assets.
The structure is very clear. In 2017 and 2021, strong altseason phases appeared when this ratio expanded aggressively against Bitcoin. Those were the periods where the broader altcoin market was not only rising in USD terms, but actually outperforming BTC.
Since the 2021 cycle top, the ratio has been compressed under a long descending structure. That means Bitcoin has dominated the deeper altcoin market for years. This is why the last few years felt so frustrating for many altcoin investors. Some coins bounced, some narratives appeared, but the broad relative structure against BTC remained weak.
Now the chart is sitting near the lower part of the long-term range again. This is the same type of area where previous major bottom structures formed. The market is not euphoric here. It is compressed, ignored and sitting close to the zone where altcoin risk historically begins to matter again.
The important part is that price is now reaching the point where the lower range support and the descending resistance are coming together. This is a decision zone.
If this ratio breaks upward from the descending structure, the message becomes much stronger. It would suggest that the broader altcoin market is no longer only surviving against Bitcoin. It is starting to rotate.
That is when the altseason thesis becomes more serious.
Until then, this is still a setup, not a confirmed expansion. But the structure is getting late. The ratio is near the bottom of the range, sentiment toward altcoins is still weak, and the market is close to a major relative-strength decision.
The key idea is simple:
Altseason is not confirmed by altcoins rising in USD.
It is confirmed when altcoins begin outperforming Bitcoin.
This chart is where that question becomes visible.
The broader altcoin market is still compressed against BTC, but it is now sitting in the area where the next major rotation attempt can begin.

▸ Crypto Cycles: cycle phase mapping, structural analysis
▸ Fractals: historical pattern, cycle anatomy
▸ Onchain
▸ Macro
▸ Market Psychology
▸Altcoin Charts
Subscribe on X → @Cryptollica
x.com/Cryptollica/creator-subscriptions/subscribe
▸ Fractals: historical pattern, cycle anatomy
▸ Onchain
▸ Macro
▸ Market Psychology
▸Altcoin Charts
Subscribe on X → @Cryptollica
x.com/Cryptollica/creator-subscriptions/subscribe
Declinazione di responsabilità
Le informazioni e le pubblicazioni non sono intese come, e non costituiscono, consulenza o raccomandazioni finanziarie, di investimento, di trading o di altro tipo fornite o approvate da TradingView. Per ulteriori informazioni, consultare i Termini di utilizzo.
▸ Crypto Cycles: cycle phase mapping, structural analysis
▸ Fractals: historical pattern, cycle anatomy
▸ Onchain
▸ Macro
▸ Market Psychology
▸Altcoin Charts
Subscribe on X → @Cryptollica
x.com/Cryptollica/creator-subscriptions/subscribe
▸ Fractals: historical pattern, cycle anatomy
▸ Onchain
▸ Macro
▸ Market Psychology
▸Altcoin Charts
Subscribe on X → @Cryptollica
x.com/Cryptollica/creator-subscriptions/subscribe
Declinazione di responsabilità
Le informazioni e le pubblicazioni non sono intese come, e non costituiscono, consulenza o raccomandazioni finanziarie, di investimento, di trading o di altro tipo fornite o approvate da TradingView. Per ulteriori informazioni, consultare i Termini di utilizzo.