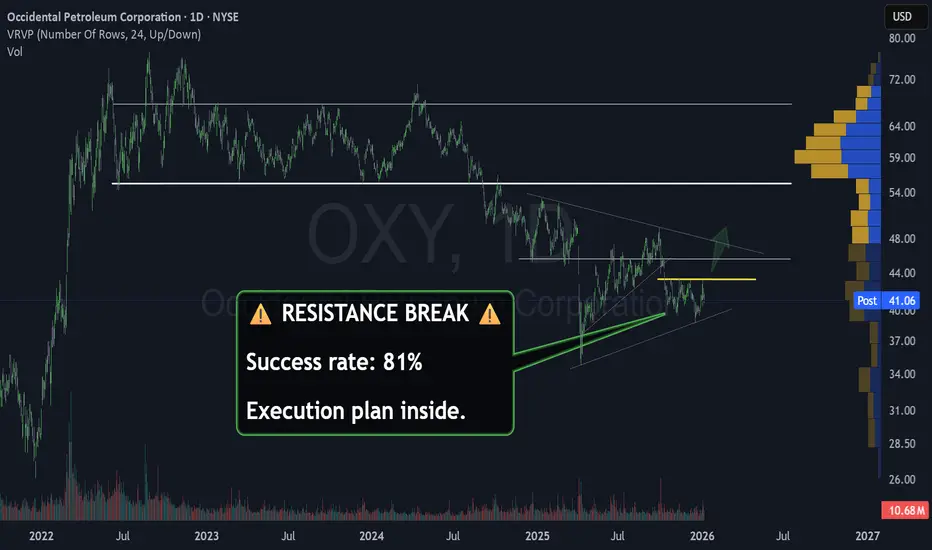
OXY seems ready to jump
When we look at the daily chart for OXY, we see a classic descending wedge structure. The price has been making lower highs for months, but the volume and price action suggest we are approaching a massive breakout point.
But the key point, a clear resistance has been formed near $34,50.
We are not just guessing on a direction. We are trading a setup that carries a historical success rate of 81% according to this specific pattern.
The Trigger: The $43.50 Level
The biggest mistake novice traders make is entering too early. They buy now because it looks cheap only to watch the price reject the resistance line and fall back toward the lows.
We do not gamble on hope. We wait for confirmation.
The level of $43.50 is our line in the sand. This area represents a key horizontal pivot. A solid close above this price is the signal that the ceiling has been removed and the path to higher prices is open.
The Execution Plan
A trader always knows where to enter, where to exit if they are wrong, and where to take profits.
Here is my plan for OXY:
Entry Trigger: Wait for a confirmed close above $43.50. Do not chase the price.
Risk Management: To protect your capital, the stop loss should be placed below the recent consolidation lows near the $41,50 mark. If the price falls back below this level, the breakout thesis is no longer valid.
Price Targets:
First Target: $48.00 (Psychological resistance and previous pivot zone).
Major Target: $55.00 (The primary technical objective where the largest concentration of previous supply sits).
Stop listening to the noise and start reading the price action.OXY is preparing for a significant move. If you have the discipline to wait for the $43.50 barrier to break, you are trading with the probabilities on your side.
Stick to the plan, manage your risk, and let the market do the rest of the work.
👇 WANT MORE?
🚀 Hit the rocket, read my profile and follow so we can find each other again :)
When we look at the daily chart for
OXY, we see a classic descending wedge structure. The price has been making lower highs for months, but the volume and price action suggest we are approaching a massive breakout point.But the key point, a clear resistance has been formed near $34,50.
We are not just guessing on a direction. We are trading a setup that carries a historical success rate of 81% according to this specific pattern.
The Trigger: The $43.50 Level
The biggest mistake novice traders make is entering too early. They buy now because it looks cheap only to watch the price reject the resistance line and fall back toward the lows.
We do not gamble on hope. We wait for confirmation.
The level of $43.50 is our line in the sand. This area represents a key horizontal pivot. A solid close above this price is the signal that the ceiling has been removed and the path to higher prices is open.
The Execution Plan
A trader always knows where to enter, where to exit if they are wrong, and where to take profits.
Here is my plan for OXY:
Entry Trigger: Wait for a confirmed close above $43.50. Do not chase the price.
Risk Management: To protect your capital, the stop loss should be placed below the recent consolidation lows near the $41,50 mark. If the price falls back below this level, the breakout thesis is no longer valid.
Price Targets:
First Target: $48.00 (Psychological resistance and previous pivot zone).
Major Target: $55.00 (The primary technical objective where the largest concentration of previous supply sits).
Stop listening to the noise and start reading the price action.
OXY is preparing for a significant move. If you have the discipline to wait for the $43.50 barrier to break, you are trading with the probabilities on your side.Stick to the plan, manage your risk, and let the market do the rest of the work.
👇 WANT MORE?
🚀 Hit the rocket, read my profile and follow so we can find each other again :)

🚀 Simple Chart Patterns. Serious Profits.
📈 +200% returns
🎯 70%+ win rate (audited)
Trade smarter, not harder.
👉topchartpatterns.substack.com/subscribe
📩 Business: info@topchartpatterns.com
📈 +200% returns
🎯 70%+ win rate (audited)
Trade smarter, not harder.
👉topchartpatterns.substack.com/subscribe
📩 Business: info@topchartpatterns.com
Pubblicazioni correlate
Declinazione di responsabilità
Le informazioni e le pubblicazioni non sono intese come, e non costituiscono, consulenza o raccomandazioni finanziarie, di investimento, di trading o di altro tipo fornite o approvate da TradingView. Per ulteriori informazioni, consultare i Termini di utilizzo.
🚀 Simple Chart Patterns. Serious Profits.
📈 +200% returns
🎯 70%+ win rate (audited)
Trade smarter, not harder.
👉topchartpatterns.substack.com/subscribe
📩 Business: info@topchartpatterns.com
📈 +200% returns
🎯 70%+ win rate (audited)
Trade smarter, not harder.
👉topchartpatterns.substack.com/subscribe
📩 Business: info@topchartpatterns.com
Pubblicazioni correlate
Declinazione di responsabilità
Le informazioni e le pubblicazioni non sono intese come, e non costituiscono, consulenza o raccomandazioni finanziarie, di investimento, di trading o di altro tipo fornite o approvate da TradingView. Per ulteriori informazioni, consultare i Termini di utilizzo.