
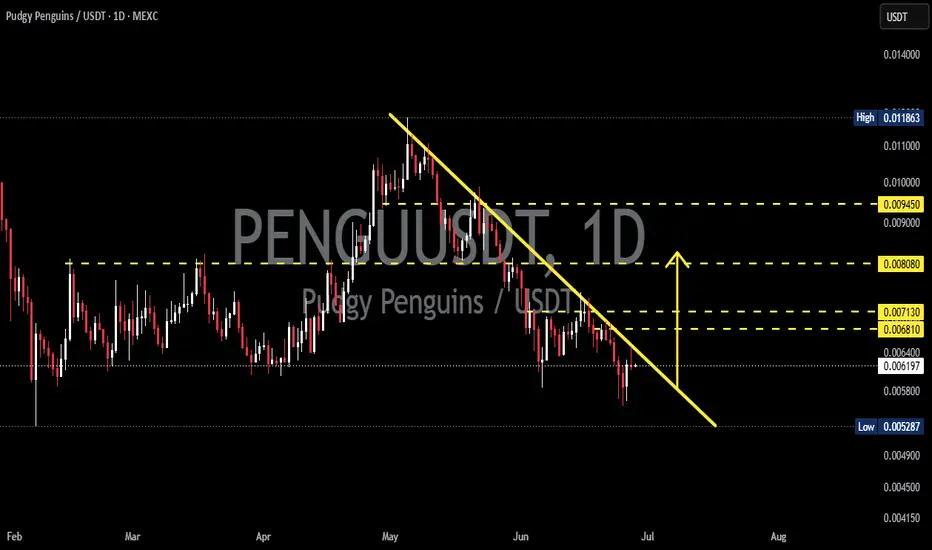
On the 1D timeframe, PENGU/USDT remains in a clear downtrend, highlighted by a well-defined 📉 Descending TrendLine connecting a series of Lower Highs since the early May peak.
📍 Price has now declined toward a key support area while once again testing the lower side of the Descending TrendLine. This is a crucial zone that could determine the market's next major move.
⚠️ As long as the price remains below the Descending TrendLine, sellers continue to dominate the market structure. However, the more frequently this resistance is tested, the greater the probability of a breakout—especially if accompanied by a significant increase in trading volume.
---
📊📉 Pattern: Descending TrendLine
A Descending TrendLine is a technical pattern that reflects persistent selling pressure, where every rally is rejected at progressively lower highs.
✨ Pattern Characteristics:
✅ Forms a sequence of Lower Highs.
✅ The trendline acts as a dynamic resistance.
✅ Trading volume generally decreases during the downward movement.
✅ A valid breakout is typically confirmed by a strong candle close above the trendline with increasing volume.
📌 Until the trendline is convincingly broken, the probability of the downtrend continuing remains higher than that of a trend reversal.
---
🚀📈 Bullish Scenario
🟢 A bullish outlook will only be confirmed if the price successfully breaks above and closes above the Descending TrendLine.
If the breakout is sustained, the next upside targets are:
🎯 Target 1: 0.006810 USDT
🎯 Target 2: 0.007130 USDT
🎯 Target 3: 0.008080 USDT
🎯 Target 4: 0.009450 USDT
💪 A breakout supported by strong trading volume would increase the probability of a market structure shift from Lower Highs to Higher Highs, signaling the potential beginning of a trend reversal.
---
📉🔻 Bearish Scenario
🔴 If the price fails to break above the Descending TrendLine and is rejected once again, selling pressure is likely to continue.
🛑 The nearest support is located around:
📍 0.005287 USDT
⚠️ If this level is broken, the downtrend could extend further, potentially creating a new Lower Low.
---
📌✅ Conclusion
PENGU/USDT is currently trading at a decisive technical level.
📉 As long as the price remains below the Descending TrendLine, the overall market bias stays bearish.
🚀 However, if a confirmed breakout occurs with strong volume, the price could advance toward the resistance zone between 0.006810 and 0.009450 USDT.
⏳ Traders should wait for either a confirmed breakout or a clear rejection, as the price reaction around this area is likely to determine the next major trend.
⚠️ Disclaimer: This analysis is based on Price Action and technical analysis. Always apply proper risk management and conduct your own research before making any trading decisions.
---
#PENGU #PENGUUSDT #Crypto #Cryptocurrency #Trading #TradingView #TechnicalAnalysis #PriceAction #DescendingTrendLine #Breakout #Resistance #Support #Altcoins #CryptoTrading #RiskManagement
📍 Price has now declined toward a key support area while once again testing the lower side of the Descending TrendLine. This is a crucial zone that could determine the market's next major move.
⚠️ As long as the price remains below the Descending TrendLine, sellers continue to dominate the market structure. However, the more frequently this resistance is tested, the greater the probability of a breakout—especially if accompanied by a significant increase in trading volume.
---
📊📉 Pattern: Descending TrendLine
A Descending TrendLine is a technical pattern that reflects persistent selling pressure, where every rally is rejected at progressively lower highs.
✨ Pattern Characteristics:
✅ Forms a sequence of Lower Highs.
✅ The trendline acts as a dynamic resistance.
✅ Trading volume generally decreases during the downward movement.
✅ A valid breakout is typically confirmed by a strong candle close above the trendline with increasing volume.
📌 Until the trendline is convincingly broken, the probability of the downtrend continuing remains higher than that of a trend reversal.
---
🚀📈 Bullish Scenario
🟢 A bullish outlook will only be confirmed if the price successfully breaks above and closes above the Descending TrendLine.
If the breakout is sustained, the next upside targets are:
🎯 Target 1: 0.006810 USDT
🎯 Target 2: 0.007130 USDT
🎯 Target 3: 0.008080 USDT
🎯 Target 4: 0.009450 USDT
💪 A breakout supported by strong trading volume would increase the probability of a market structure shift from Lower Highs to Higher Highs, signaling the potential beginning of a trend reversal.
---
📉🔻 Bearish Scenario
🔴 If the price fails to break above the Descending TrendLine and is rejected once again, selling pressure is likely to continue.
🛑 The nearest support is located around:
📍 0.005287 USDT
⚠️ If this level is broken, the downtrend could extend further, potentially creating a new Lower Low.
---
📌✅ Conclusion
PENGU/USDT is currently trading at a decisive technical level.
📉 As long as the price remains below the Descending TrendLine, the overall market bias stays bearish.
🚀 However, if a confirmed breakout occurs with strong volume, the price could advance toward the resistance zone between 0.006810 and 0.009450 USDT.
⏳ Traders should wait for either a confirmed breakout or a clear rejection, as the price reaction around this area is likely to determine the next major trend.
⚠️ Disclaimer: This analysis is based on Price Action and technical analysis. Always apply proper risk management and conduct your own research before making any trading decisions.
---
#PENGU #PENGUUSDT #Crypto #Cryptocurrency #Trading #TradingView #TechnicalAnalysis #PriceAction #DescendingTrendLine #Breakout #Resistance #Support #Altcoins #CryptoTrading #RiskManagement

✅ Get Free Signals! Join Our Telegram Channel Here: t.me/TheCryptoNuclear
✅ Twitter: twitter.com/crypto_nuclear
✅ Join Bybit : partner.bybit.com/b/nuclearvip
✅ Benefits : Lifetime Trading Fee Discount -50%
✅ Twitter: twitter.com/crypto_nuclear
✅ Join Bybit : partner.bybit.com/b/nuclearvip
✅ Benefits : Lifetime Trading Fee Discount -50%
Declinazione di responsabilità
Le informazioni e le pubblicazioni non sono intese come, e non costituiscono, consulenza o raccomandazioni finanziarie, di investimento, di trading o di altro tipo fornite o approvate da TradingView. Per ulteriori informazioni, consultare i Termini di utilizzo.
✅ Get Free Signals! Join Our Telegram Channel Here: t.me/TheCryptoNuclear
✅ Twitter: twitter.com/crypto_nuclear
✅ Join Bybit : partner.bybit.com/b/nuclearvip
✅ Benefits : Lifetime Trading Fee Discount -50%
✅ Twitter: twitter.com/crypto_nuclear
✅ Join Bybit : partner.bybit.com/b/nuclearvip
✅ Benefits : Lifetime Trading Fee Discount -50%
Declinazione di responsabilità
Le informazioni e le pubblicazioni non sono intese come, e non costituiscono, consulenza o raccomandazioni finanziarie, di investimento, di trading o di altro tipo fornite o approvate da TradingView. Per ulteriori informazioni, consultare i Termini di utilizzo.