
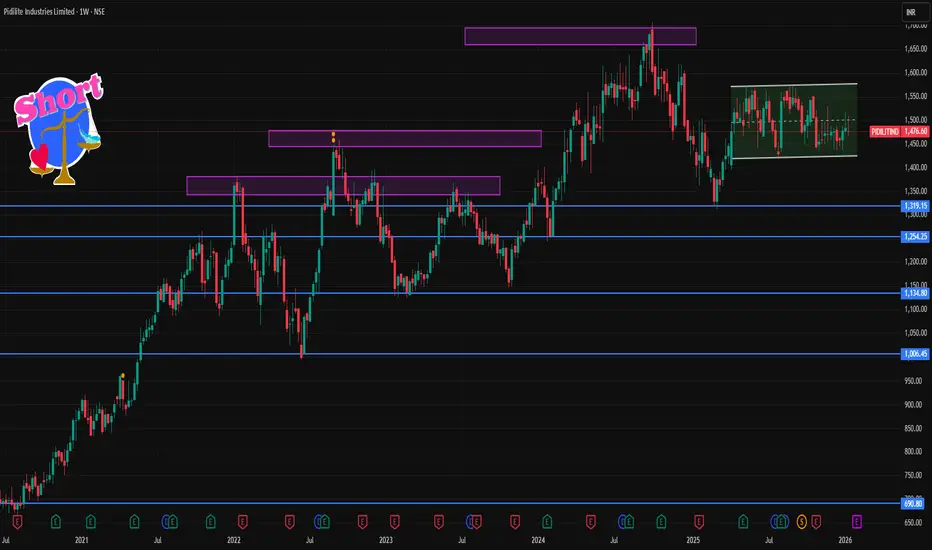
📌 Current Weekly Price Context (as of 16‑17 Jan 2026)
Last seen price: ~₹1,475 on NSE (latest technical snapshot)
Weekly momentum on short/medium averages is neutral (no strong trend bullish or bearish on EMA/SMA clusters)
RSI and other oscillators are also neutral to modestly positive — not extreme.
📈 Weekly Pivot & Key Levels (classic weekly pivot analysis)
Resistance Zones
1. R1: ~₹1,498–₹1,500
2. R2: ~₹1,507–₹1,520
3. R3: ~₹1,520+ (next cluster)
(Weekly pivot resistances based on recent price action)
Pivot Point
Weekly Pivot: ~₹1,484–₹1,486
Above this pivot → slightly bullish bias; below → slightly bearish
Support Zones
1. S1: ~₹1,476–₹1,478
2. S2: ~₹1,462–₹1,470
3. S3: ~₹1,453–₹1,456
(Weekly pivot support levels)
📅 Weekly Levels Summary (Rounded)
Level Price Zone (Approx)
R3 ₹1,520+
R2 ₹1,507–₹1,520
R1 ₹1,498–₹1,500
Pivot ₹1,484–₹1,486
S1 ₹1,476–₹1,478
S2 ₹1,462–₹1,470
S3 ₹1,453–₹1,456

Contact Knowledgehub for a detailed consultation: Dm on WhatsApp: [wa.link/a2o0kz]-
Phone No: [+91 93102 26243]-
Email: [tradingviewknowledgehub@gmail.com]---
-- Let’s achieve success together!
Phone No: [+91 93102 26243]-
Email: [tradingviewknowledgehub@gmail.com]---
-- Let’s achieve success together!
Pubblicazioni correlate
Declinazione di responsabilità
Le informazioni e le pubblicazioni non sono intese come, e non costituiscono, consulenza o raccomandazioni finanziarie, di investimento, di trading o di altro tipo fornite o approvate da TradingView. Per ulteriori informazioni, consultare i Termini di utilizzo.