
📊 Technical Analysis
💵 Coin: $PNUT / USDT Perpetual
⏳ Time Frame: 12H
🚩 Pattern: Bear Flag
🎯 Outlook: Trend Continuation (Bearish Bias)
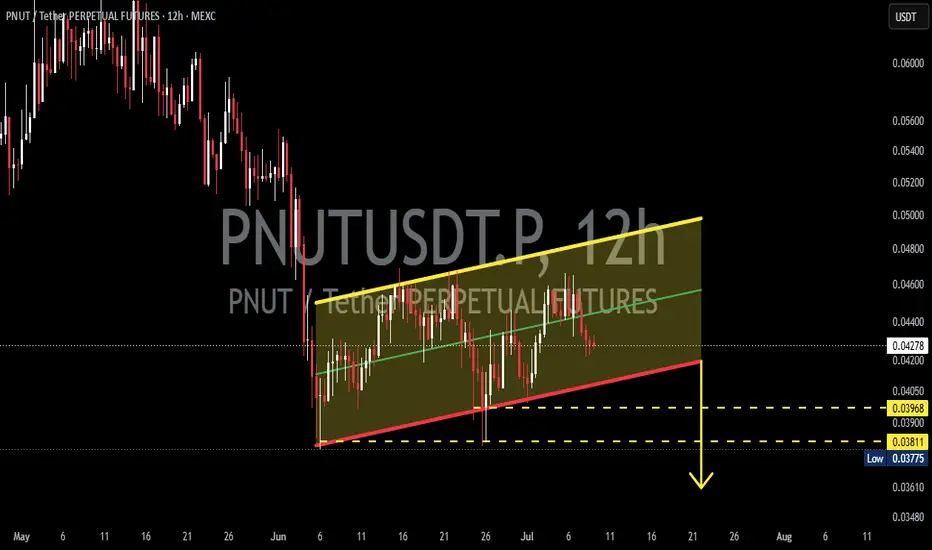
PNUT is currently forming a 🚩 Bear Flag, a bearish continuation pattern that typically develops after a strong sell-off (📉 Flagpole), followed by a temporary consolidation inside a slightly ascending channel (📈 Flag).
On this chart, the price is moving within an 📐 ascending channel, serving as a temporary consolidation zone. However, this upward movement has not been strong enough to shift the overall market structure into a bullish trend, as it still appears to be a corrective move within the previous downtrend.
⚠️ The price is now beginning to lose momentum near the middle of the channel and could retest the lower support. As long as the price remains inside the Bear Flag, the risk of another bearish continuation remains dominant.
---
🐻📉 Bearish Scenario (Higher Probability)
🔻 If the price breaks below the lower support trendline of the Bear Flag with a valid 12H candle close accompanied by increasing volume, the Bear Flag pattern is likely to be confirmed.
🎯 The first downside target is the 🟨 Yellow Block between 0.03968 – 0.03811, which represents a significant support zone.
📉 If selling pressure continues and this support area fails to hold, the probability of a deeper decline toward the next support level increases, as indicated by the downward arrow on the chart.
📊 🐻 Bearish Probability: 75%
---
🟢🚀 Bullish Scenario
✅ The bullish scenario becomes more likely if the price can:
🟢 Hold above the lower channel support.
🚀 Break above the upper resistance of the Bear Flag.
📈 Close with a strong bullish candle supported by increasing trading volume.
💥 Such a breakout would invalidate the Bear Flag pattern and could trigger a momentum shift toward higher resistance levels.
⚠️ However, until a confirmed breakout occurs, any upward movement should still be considered a relief rally within the broader downtrend.
📊 🟢 Bullish Probability: 25%
---
📚🚩 Bear Flag Pattern Explanation
The 🚩 Bear Flag is one of the most reliable bearish continuation patterns, commonly forming after a strong downward price movement.
📌 Pattern Characteristics:
🔻 Begins with a sharp decline (📉 Flagpole).
📈 Followed by a temporary consolidation inside a slightly rising or sideways channel (🚩 Flag).
📉 Trading volume usually decreases during the flag formation.
⚠️ Confirmation occurs when the price breaks below the lower boundary of the channel.
🎯 After the breakdown, the price often continues its downtrend with a minimum target equal to the height of the Flagpole.
📍 As long as the lower support of the Bear Flag remains intact, the pattern is still developing and requires confirmation.
---
📝📌 Conclusion
🚩 PNUT continues to trade within a Bear Flag structure, suggesting that the recent upward movement is more likely a consolidation phase rather than a genuine trend reversal.
🟨 The 0.03968 – 0.03811 area is a key support zone that traders should monitor closely.
🔻 A breakdown below this zone would strengthen bearish momentum and increase the likelihood of further downside.
🚀 On the other hand, a breakout above the upper boundary of the Bear Flag would be the first indication that bearish pressure is fading and that the market structure may begin to shift.
---
#PNUT 🚀 #PNUTUSDT 📉 #Crypto 🪙 #Cryptocurrency 🌐 #Trading 📊 #TechnicalAnalysis 📈 #TradingView 💹 #BearFlag 🚩 #Bearish 🐻 #PriceAction 📉 #Altcoins 💎 #Support 🟨 #Resistance 🔴 #ChartPattern 📚 #CryptoTrading ⚡ #MEXC 🔥 #Futures 📉 #MarketAnalysis 📊 #Breakdown 💥 #TrendContinuation 🚨
💵 Coin: $PNUT / USDT Perpetual
⏳ Time Frame: 12H
🚩 Pattern: Bear Flag
🎯 Outlook: Trend Continuation (Bearish Bias)
PNUT is currently forming a 🚩 Bear Flag, a bearish continuation pattern that typically develops after a strong sell-off (📉 Flagpole), followed by a temporary consolidation inside a slightly ascending channel (📈 Flag).
On this chart, the price is moving within an 📐 ascending channel, serving as a temporary consolidation zone. However, this upward movement has not been strong enough to shift the overall market structure into a bullish trend, as it still appears to be a corrective move within the previous downtrend.
⚠️ The price is now beginning to lose momentum near the middle of the channel and could retest the lower support. As long as the price remains inside the Bear Flag, the risk of another bearish continuation remains dominant.
---
🐻📉 Bearish Scenario (Higher Probability)
🔻 If the price breaks below the lower support trendline of the Bear Flag with a valid 12H candle close accompanied by increasing volume, the Bear Flag pattern is likely to be confirmed.
🎯 The first downside target is the 🟨 Yellow Block between 0.03968 – 0.03811, which represents a significant support zone.
📉 If selling pressure continues and this support area fails to hold, the probability of a deeper decline toward the next support level increases, as indicated by the downward arrow on the chart.
📊 🐻 Bearish Probability: 75%
---
🟢🚀 Bullish Scenario
✅ The bullish scenario becomes more likely if the price can:
🟢 Hold above the lower channel support.
🚀 Break above the upper resistance of the Bear Flag.
📈 Close with a strong bullish candle supported by increasing trading volume.
💥 Such a breakout would invalidate the Bear Flag pattern and could trigger a momentum shift toward higher resistance levels.
⚠️ However, until a confirmed breakout occurs, any upward movement should still be considered a relief rally within the broader downtrend.
📊 🟢 Bullish Probability: 25%
---
📚🚩 Bear Flag Pattern Explanation
The 🚩 Bear Flag is one of the most reliable bearish continuation patterns, commonly forming after a strong downward price movement.
📌 Pattern Characteristics:
🔻 Begins with a sharp decline (📉 Flagpole).
📈 Followed by a temporary consolidation inside a slightly rising or sideways channel (🚩 Flag).
📉 Trading volume usually decreases during the flag formation.
⚠️ Confirmation occurs when the price breaks below the lower boundary of the channel.
🎯 After the breakdown, the price often continues its downtrend with a minimum target equal to the height of the Flagpole.
📍 As long as the lower support of the Bear Flag remains intact, the pattern is still developing and requires confirmation.
---
📝📌 Conclusion
🚩 PNUT continues to trade within a Bear Flag structure, suggesting that the recent upward movement is more likely a consolidation phase rather than a genuine trend reversal.
🟨 The 0.03968 – 0.03811 area is a key support zone that traders should monitor closely.
🔻 A breakdown below this zone would strengthen bearish momentum and increase the likelihood of further downside.
🚀 On the other hand, a breakout above the upper boundary of the Bear Flag would be the first indication that bearish pressure is fading and that the market structure may begin to shift.
---
#PNUT 🚀 #PNUTUSDT 📉 #Crypto 🪙 #Cryptocurrency 🌐 #Trading 📊 #TechnicalAnalysis 📈 #TradingView 💹 #BearFlag 🚩 #Bearish 🐻 #PriceAction 📉 #Altcoins 💎 #Support 🟨 #Resistance 🔴 #ChartPattern 📚 #CryptoTrading ⚡ #MEXC 🔥 #Futures 📉 #MarketAnalysis 📊 #Breakdown 💥 #TrendContinuation 🚨

✅ Get Free Signals! Join Our Telegram Channel Here: t.me/TheCryptoNuclear
✅ Twitter: twitter.com/crypto_nuclear
✅ Join Bybit : partner.bybit.com/b/nuclearvip
✅ Benefits : Lifetime Trading Fee Discount -50%
✅ Twitter: twitter.com/crypto_nuclear
✅ Join Bybit : partner.bybit.com/b/nuclearvip
✅ Benefits : Lifetime Trading Fee Discount -50%
Declinazione di responsabilità
Le informazioni e le pubblicazioni non sono intese come, e non costituiscono, consulenza o raccomandazioni finanziarie, di investimento, di trading o di altro tipo fornite o approvate da TradingView. Per ulteriori informazioni, consultare i Termini di utilizzo.
✅ Get Free Signals! Join Our Telegram Channel Here: t.me/TheCryptoNuclear
✅ Twitter: twitter.com/crypto_nuclear
✅ Join Bybit : partner.bybit.com/b/nuclearvip
✅ Benefits : Lifetime Trading Fee Discount -50%
✅ Twitter: twitter.com/crypto_nuclear
✅ Join Bybit : partner.bybit.com/b/nuclearvip
✅ Benefits : Lifetime Trading Fee Discount -50%
Declinazione di responsabilità
Le informazioni e le pubblicazioni non sono intese come, e non costituiscono, consulenza o raccomandazioni finanziarie, di investimento, di trading o di altro tipo fornite o approvate da TradingView. Per ulteriori informazioni, consultare i Termini di utilizzo.