
Key Chart Observations
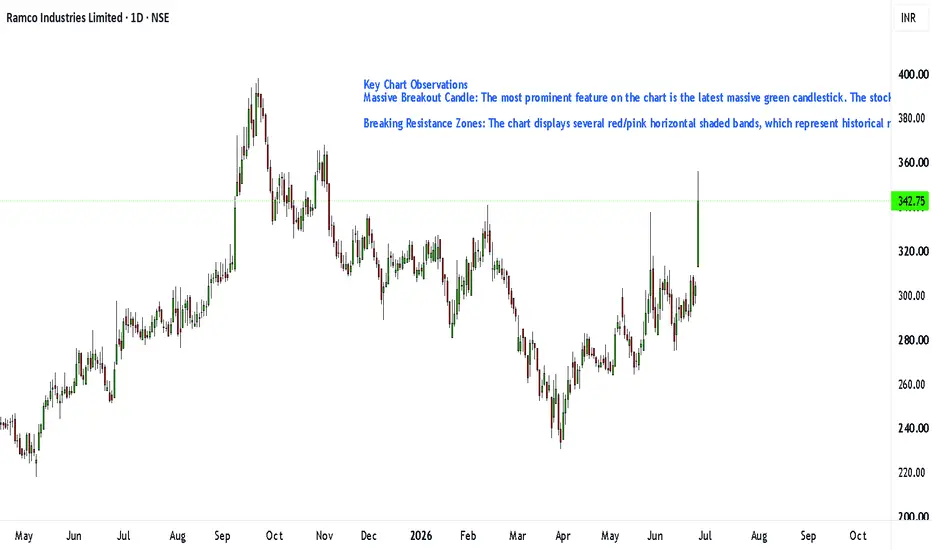
Massive Breakout Candle: The most prominent feature on the chart is the latest massive green candlestick. The stock opened at 313.00 and surged to a high of 356.00 before closing at 342.75, representing a massive ~12.7% intraday gain. This indicates overwhelming buying pressure and a significant momentum shift.
Breaking Resistance Zones: The chart displays several red/pink horizontal shaded bands, which represent historical resistance and supply zones. The recent price action aggressively shattered the major resistance cluster around the 313.00 - 320.00 level, turning this previous ceiling into potential new support.
Massive Breakout Candle: The most prominent feature on the chart is the latest massive green candlestick. The stock opened at 313.00 and surged to a high of 356.00 before closing at 342.75, representing a massive ~12.7% intraday gain. This indicates overwhelming buying pressure and a significant momentum shift.
Breaking Resistance Zones: The chart displays several red/pink horizontal shaded bands, which represent historical resistance and supply zones. The recent price action aggressively shattered the major resistance cluster around the 313.00 - 320.00 level, turning this previous ceiling into potential new support.

Automated Tools/Indicators/Screeners available at kkonline.org/nimblrta
Declinazione di responsabilità
Le informazioni e le pubblicazioni non sono intese come, e non costituiscono, consulenza o raccomandazioni finanziarie, di investimento, di trading o di altro tipo fornite o approvate da TradingView. Per ulteriori informazioni, consultare i Termini di utilizzo.
Automated Tools/Indicators/Screeners available at kkonline.org/nimblrta
Declinazione di responsabilità
Le informazioni e le pubblicazioni non sono intese come, e non costituiscono, consulenza o raccomandazioni finanziarie, di investimento, di trading o di altro tipo fornite o approvate da TradingView. Per ulteriori informazioni, consultare i Termini di utilizzo.