
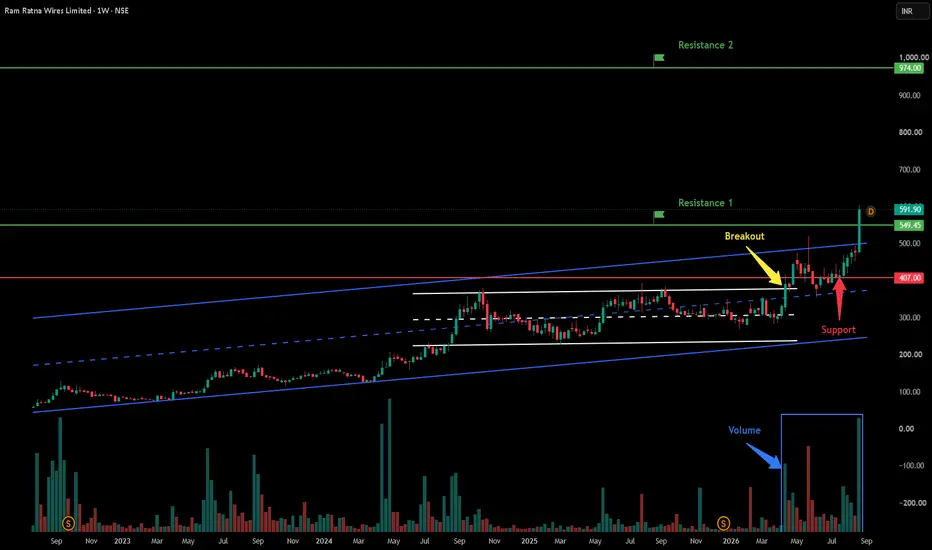
#RAMRAT trading above Resistance of 549.45
Next Resistance is at 974
Support is at 407
Here is previous chart:
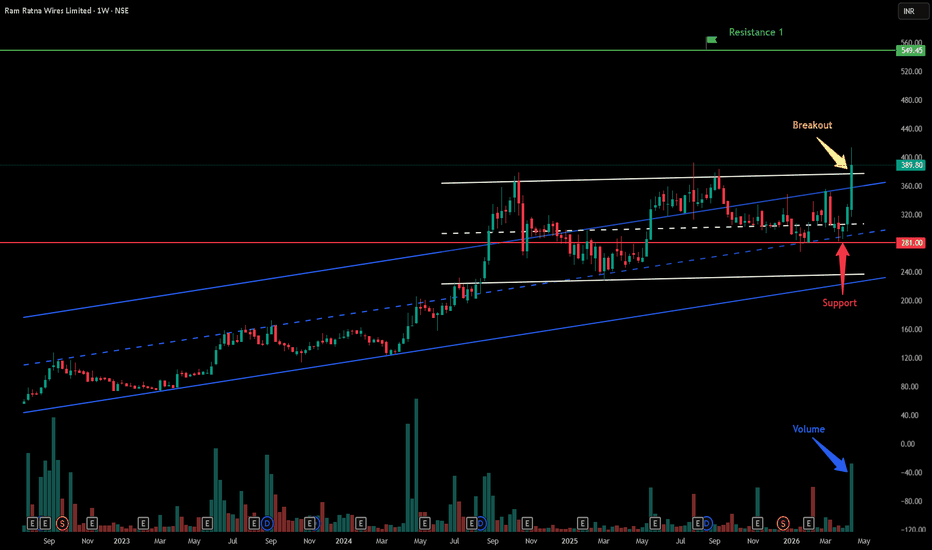
This weekly candlestick chart for Ram Ratna Wires Limited (NSE) shows a breakout from a long-term consolidation range within a multi-year ascending parallel channel, leading to a strong trend expansion.
Key Technical Elements
Breakout Point (~407.00): After consolidating inside a horizontal rectangle range between 2024 and mid-2026 within its larger ascending channel, the stock broke out above the range ceiling and horizontal resistance around 407.00 with a bullish weekly candle (marked with a yellow arrow), signaling trend acceleration.
Volume Analysis: The blue arrow and boxed region highlight a substantial surge in trading volume during the initial breakout in mid-2026, followed by another sharp expansion on the latest weekly bar, confirming high institutional interest and accumulation.
Support Levels:
300.00 - 407.00: The original base and horizontal breakout ceiling.
407.00: Marked with a red arrow, this horizontal baseline acted as resistance during the initial breakout before being retested and successfully flipped into strong dynamic support during pullbacks.
Resistance Levels:
Resistance 1 (549.45): The immediate horizontal resistance zone currently being tested. The stock surged to close at 591.90 (+24.00% on the weekly bar).
Resistance 2 (974.00): The primary long-term upside resistance if the stock cleanly breaks and holds above Resistance 1.
Current Price Action
The stock has decisively surpassed 549.45 and is testing the 591.90 region at Resistance 1. A sustained weekly close above this zone opens up the upside trajectory toward the major 974.00 long-term target. If Resistance 1 dynamic pressure triggers short-term profit-taking, a healthy pullback or retest toward the 407.00 horizontal support floor may occur.
A parallel channel (also known as an ascending, descending, or horizontal channel) is a technical analysis pattern bounded by two parallel trendlines that encompass a security’s price action over time.
Structure & Mechanics
Main Components:
Trendline / Base Line: Connects a series of prominent reaction lows (in an uptrend) or reaction highs (in a downtrend).
Channel Line: Drawn parallel to the trendline, connecting the peaks (top boundary) or troughs (bottom boundary).
Price Movement: Price oscillates between the upper boundary (which acts as dynamic resistance) and the lower boundary (which acts as dynamic support).
Types of Channels
Ascending Channel (Bullish): Characterized by higher highs and higher lows. Indicates a steady uptrend where buying pressure dominates.
Descending Channel (Bearish): Characterized by lower highs and lower lows. Represents a controlled downtrend or corrective pullback.
Horizontal Channel (Consolidation): Moving sideways between static support and resistance lines, signaling market indecision or range-bound trading.
How Traders Use Parallel Channels
Trading Within the Range: Buying near the channel's lower boundary (support) and selling or shorting near the upper boundary (resistance).
Breakout Trading: A strong, high-volume candle breaking outside either boundary signals potential trend acceleration or continuation in the direction of the breakout (as seen in the charts provided previously).
Midline (50% Line): Often, a dashed line is drawn down the middle of the channel. Price reacting to this midline can confirm the channel's validity and act as interim support or resistance.
Chart is self explanatory. Levels of breakout, possible up-moves (where stock may find resistances) and support (close below which, setup will be invalidated) are clearly defined.
Disclaimer: This is for demonstration and educational purpose only. This is not buying or selling recommendations. I am not SEBI registered. Please consult your financial advisor before taking any trade.
Next Resistance is at 974
Support is at 407
Here is previous chart:
This weekly candlestick chart for Ram Ratna Wires Limited (NSE) shows a breakout from a long-term consolidation range within a multi-year ascending parallel channel, leading to a strong trend expansion.
Key Technical Elements
Breakout Point (~407.00): After consolidating inside a horizontal rectangle range between 2024 and mid-2026 within its larger ascending channel, the stock broke out above the range ceiling and horizontal resistance around 407.00 with a bullish weekly candle (marked with a yellow arrow), signaling trend acceleration.
Volume Analysis: The blue arrow and boxed region highlight a substantial surge in trading volume during the initial breakout in mid-2026, followed by another sharp expansion on the latest weekly bar, confirming high institutional interest and accumulation.
Support Levels:
300.00 - 407.00: The original base and horizontal breakout ceiling.
407.00: Marked with a red arrow, this horizontal baseline acted as resistance during the initial breakout before being retested and successfully flipped into strong dynamic support during pullbacks.
Resistance Levels:
Resistance 1 (549.45): The immediate horizontal resistance zone currently being tested. The stock surged to close at 591.90 (+24.00% on the weekly bar).
Resistance 2 (974.00): The primary long-term upside resistance if the stock cleanly breaks and holds above Resistance 1.
Current Price Action
The stock has decisively surpassed 549.45 and is testing the 591.90 region at Resistance 1. A sustained weekly close above this zone opens up the upside trajectory toward the major 974.00 long-term target. If Resistance 1 dynamic pressure triggers short-term profit-taking, a healthy pullback or retest toward the 407.00 horizontal support floor may occur.
A parallel channel (also known as an ascending, descending, or horizontal channel) is a technical analysis pattern bounded by two parallel trendlines that encompass a security’s price action over time.
Structure & Mechanics
Main Components:
Trendline / Base Line: Connects a series of prominent reaction lows (in an uptrend) or reaction highs (in a downtrend).
Channel Line: Drawn parallel to the trendline, connecting the peaks (top boundary) or troughs (bottom boundary).
Price Movement: Price oscillates between the upper boundary (which acts as dynamic resistance) and the lower boundary (which acts as dynamic support).
Types of Channels
Ascending Channel (Bullish): Characterized by higher highs and higher lows. Indicates a steady uptrend where buying pressure dominates.
Descending Channel (Bearish): Characterized by lower highs and lower lows. Represents a controlled downtrend or corrective pullback.
Horizontal Channel (Consolidation): Moving sideways between static support and resistance lines, signaling market indecision or range-bound trading.
How Traders Use Parallel Channels
Trading Within the Range: Buying near the channel's lower boundary (support) and selling or shorting near the upper boundary (resistance).
Breakout Trading: A strong, high-volume candle breaking outside either boundary signals potential trend acceleration or continuation in the direction of the breakout (as seen in the charts provided previously).
Midline (50% Line): Often, a dashed line is drawn down the middle of the channel. Price reacting to this midline can confirm the channel's validity and act as interim support or resistance.
Chart is self explanatory. Levels of breakout, possible up-moves (where stock may find resistances) and support (close below which, setup will be invalidated) are clearly defined.
Disclaimer: This is for demonstration and educational purpose only. This is not buying or selling recommendations. I am not SEBI registered. Please consult your financial advisor before taking any trade.

To Learn Price Action Trading & to get our exclusive breakout charts, subscribe here:
linktr.ee/9amprime
Join Telegram (Free) : t.me/join_9amPrime
Contact us : 9amprime@gmail.com
linktr.ee/9amprime
Join Telegram (Free) : t.me/join_9amPrime
Contact us : 9amprime@gmail.com
Declinazione di responsabilità
Le informazioni e le pubblicazioni non sono intese come, e non costituiscono, consulenza o raccomandazioni finanziarie, di investimento, di trading o di altro tipo fornite o approvate da TradingView. Per ulteriori informazioni, consultare i Termini di utilizzo.
To Learn Price Action Trading & to get our exclusive breakout charts, subscribe here:
linktr.ee/9amprime
Join Telegram (Free) : t.me/join_9amPrime
Contact us : 9amprime@gmail.com
linktr.ee/9amprime
Join Telegram (Free) : t.me/join_9amPrime
Contact us : 9amprime@gmail.com
Declinazione di responsabilità
Le informazioni e le pubblicazioni non sono intese come, e non costituiscono, consulenza o raccomandazioni finanziarie, di investimento, di trading o di altro tipo fornite o approvate da TradingView. Per ulteriori informazioni, consultare i Termini di utilizzo.