
Previously on RSRUSDT
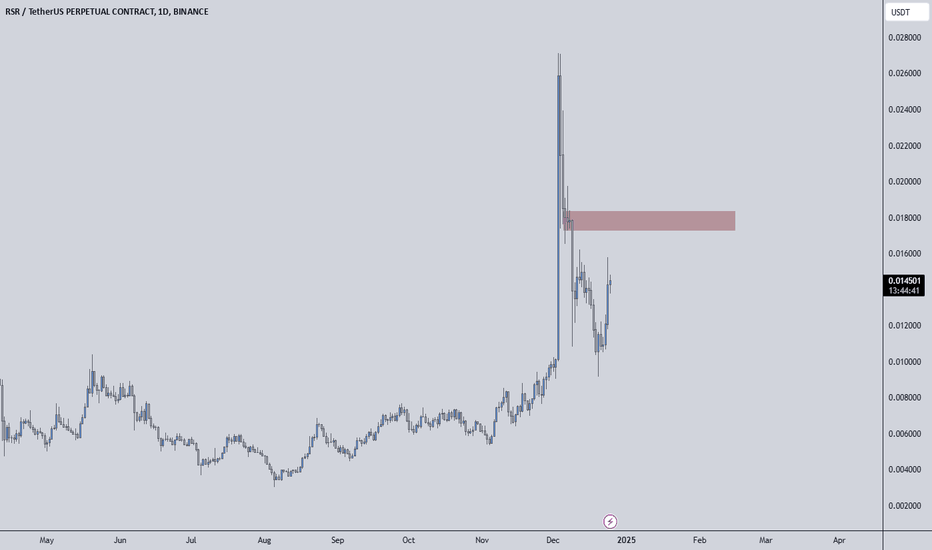 %80 Profit!
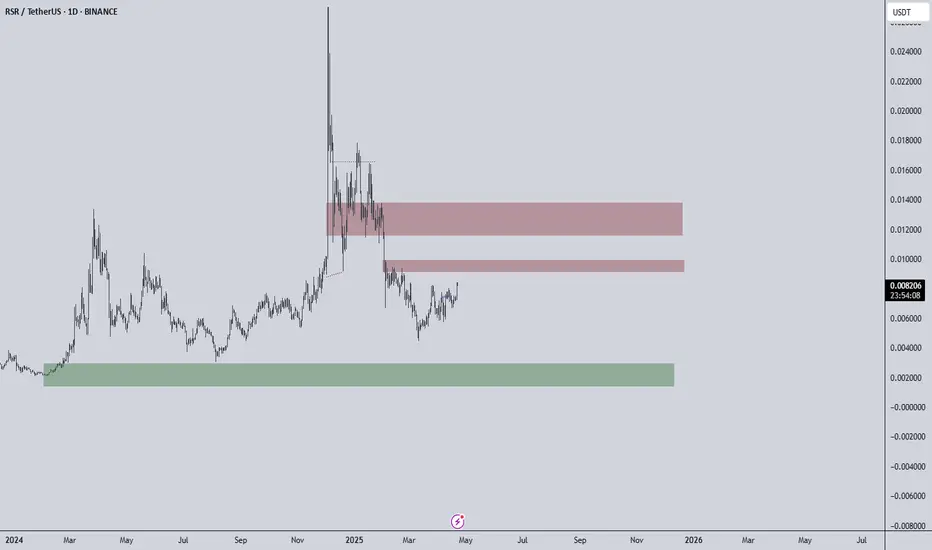
We just banked an 80 percent gain from shorting at the red box in RSRUSDT—an incredible outcome that followed our earlier winner. Now it’s clear what really matters on this chart: the red boxes are your go‑to resistance zones and the green box is the support to watch.
🔴 Red Boxes = Resistance
Every time price has reached these red boxes, sellers have stepped in hard. For short setups, wait for lower‑time‑frame breakdowns confirmed by CDV weakness and volume spikes. That’s when you know it’s safe to act.
🟢 Green Box = Support
On any pullback, the green box has reliably attracted buyers. If price dips into this zone, look for clean higher‑lows on a 5‑ or 15‑minute chart plus positive CDV shifts before considering a long entry.
🎯 Trade with Clarity
Enter short at red boxes only after seeing LTF structure breaks and confluence on your indicators.
Enter long at the green box once lower‑time‑frame breakouts and CDV confirmation signal genuine demand.
I will not insist on my short idea. If price breaks above a red box without a downward break on the low time frame, I won’t force a short. If it breaks up with volume and retests, I’ll flip and look long.
You’ve seen these levels work again and again—just like that recent 80 percent profit. Keep watching these zones, stay patient, and let the market validate each move before you pull the trigger.
📌I keep my charts clean and simple because I believe clarity leads to better decisions.
📌My approach is built on years of experience and a solid track record. I don’t claim to know it all but I’m confident in my ability to spot high-probability setups.
📌If you would like to learn how to use the heatmap, cumulative volume delta and volume footprint techniques that I use below to determine very accurate demand regions, you can send me a private message. I help anyone who wants it completely free of charge.
🔑I have a long list of my proven technique below:
I stopped adding to the list because it's kinda tiring to add 5-10 charts in every move but you can check my profile and see that it goes on..
We just banked an 80 percent gain from shorting at the red box in RSRUSDT—an incredible outcome that followed our earlier winner. Now it’s clear what really matters on this chart: the red boxes are your go‑to resistance zones and the green box is the support to watch.
🔴 Red Boxes = Resistance
Every time price has reached these red boxes, sellers have stepped in hard. For short setups, wait for lower‑time‑frame breakdowns confirmed by CDV weakness and volume spikes. That’s when you know it’s safe to act.
🟢 Green Box = Support
On any pullback, the green box has reliably attracted buyers. If price dips into this zone, look for clean higher‑lows on a 5‑ or 15‑minute chart plus positive CDV shifts before considering a long entry.
🎯 Trade with Clarity
Enter short at red boxes only after seeing LTF structure breaks and confluence on your indicators.
Enter long at the green box once lower‑time‑frame breakouts and CDV confirmation signal genuine demand.
I will not insist on my short idea. If price breaks above a red box without a downward break on the low time frame, I won’t force a short. If it breaks up with volume and retests, I’ll flip and look long.
You’ve seen these levels work again and again—just like that recent 80 percent profit. Keep watching these zones, stay patient, and let the market validate each move before you pull the trigger.
📌I keep my charts clean and simple because I believe clarity leads to better decisions.
📌My approach is built on years of experience and a solid track record. I don’t claim to know it all but I’m confident in my ability to spot high-probability setups.
📌If you would like to learn how to use the heatmap, cumulative volume delta and volume footprint techniques that I use below to determine very accurate demand regions, you can send me a private message. I help anyone who wants it completely free of charge.
🔑I have a long list of my proven technique below:
- 🎯 ZENUSDT.P: Patience & Profitability | %230 Reaction from the Sniper Entry
- 🐶 DOGEUSDT.P: Next Move
- 🎨 RENDERUSDT.P: Opportunity of the Month
- 💎 ETHUSDT.P: Where to Retrace
- 🟢 BNBUSDT.P: Potential Surge
- 📊 BTC Dominance: Reaction Zone
- 🌊 WAVESUSDT.P: Demand Zone Potential
- 🟣 UNIUSDT.P: Long-Term Trade
- 🔵 XRPUSDT.P: Entry Zones
- 🔗 LINKUSDT.P: Follow The River
- 📈 BTCUSDT.P: Two Key Demand Zones
- 🟩 POLUSDT: Bullish Momentum
- 🌟 PENDLEUSDT.P: Where Opportunity Meets Precision
- 🔥 BTCUSDT.P: Liquidation of Highly Leveraged Longs
- 🌊 SOLUSDT.P: SOL's Dip - Your Opportunity
- 🐸 1000PEPEUSDT.P: Prime Bounce Zone Unlocked
- 🚀 ETHUSDT.P: Set to Explode - Don't Miss This Game Changer
- 🤖 IQUSDT: Smart Plan
- ⚡️ PONDUSDT: A Trade Not Taken Is Better Than a Losing One
- 💼 STMXUSDT: 2 Buying Areas
- 🐢 TURBOUSDT: Buy Zones and Buyer Presence
- 🌍 ICPUSDT.P: Massive Upside Potential | Check the Trade Update For Seeing Results
- 🟠 IDEXUSDT: Spot Buy Area | %26 Profit if You Trade with MSB
- 📌 USUALUSDT: Buyers Are Active + %70 Profit in Total
- 🌟 FORTHUSDT: Sniper Entry +%26 Reaction
- 🐳 QKCUSDT: Sniper Entry +%57 Reaction
- 📊 BTC.D: Retest of Key Area Highly Likely
- 📊 XNOUSDT %80 Reaction with a Simple Blue Box!
- 📊 BELUSDT Amazing %120 Reaction!
I stopped adding to the list because it's kinda tiring to add 5-10 charts in every move but you can check my profile and see that it goes on..

Pubblicazioni correlate
Declinazione di responsabilità
Le informazioni e le pubblicazioni non sono intese come, e non costituiscono, consulenza o raccomandazioni finanziarie, di investimento, di trading o di altro tipo fornite o approvate da TradingView. Per ulteriori informazioni, consultare i Termini di utilizzo.
Pubblicazioni correlate
Declinazione di responsabilità
Le informazioni e le pubblicazioni non sono intese come, e non costituiscono, consulenza o raccomandazioni finanziarie, di investimento, di trading o di altro tipo fornite o approvate da TradingView. Per ulteriori informazioni, consultare i Termini di utilizzo.