
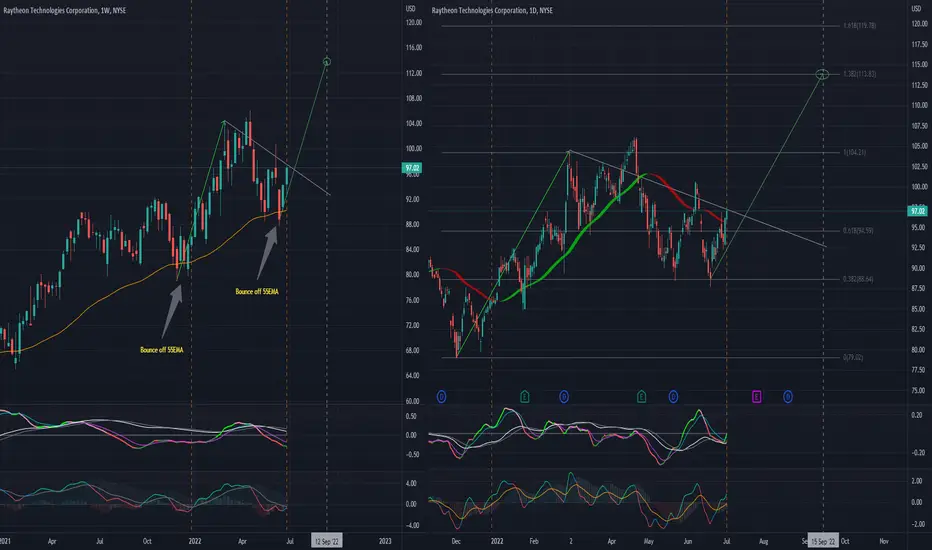
A repeated patter on the weekly RTX chart appears to be forming, and technical indicators are set up similarly.
The daily chart is also in alignment as previously. Technical Indicators have just crossed over and suggest a breakout is in order.
About 15% upside potential with upside target at 113.80, about mid-September 2022.
Fundamental and geopolitical alignment should start appearing soon...
Watch this one!
The daily chart is also in alignment as previously. Technical Indicators have just crossed over and suggest a breakout is in order.
About 15% upside potential with upside target at 113.80, about mid-September 2022.
Fundamental and geopolitical alignment should start appearing soon...
Watch this one!

Declinazione di responsabilità
Le informazioni e le pubblicazioni non sono intese come, e non costituiscono, consulenza o raccomandazioni finanziarie, di investimento, di trading o di altro tipo fornite o approvate da TradingView. Per ulteriori informazioni, consultare i Termini di utilizzo.
Declinazione di responsabilità
Le informazioni e le pubblicazioni non sono intese come, e non costituiscono, consulenza o raccomandazioni finanziarie, di investimento, di trading o di altro tipo fornite o approvate da TradingView. Per ulteriori informazioni, consultare i Termini di utilizzo.