
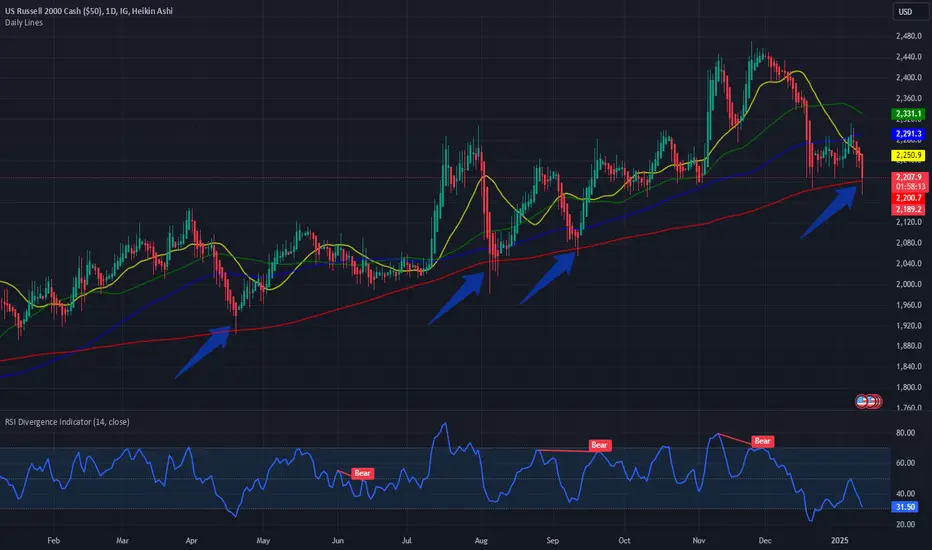
#TGIF. A simple chart to end the week. The US Small Cap index Russel 2000 its just hovering above its 200 Day SMA on the daily chart. Every time this happened in the last 1 year it was a bullish indicator in a medium term. The 50- and 100-Day SMA are below the 20 Day SMA which is a short term bearish indicator.

Declinazione di responsabilità
Le informazioni e le pubblicazioni non sono intese come, e non costituiscono, consulenza o raccomandazioni finanziarie, di investimento, di trading o di altro tipo fornite o approvate da TradingView. Per ulteriori informazioni, consultare i Termini di utilizzo.
Declinazione di responsabilità
Le informazioni e le pubblicazioni non sono intese come, e non costituiscono, consulenza o raccomandazioni finanziarie, di investimento, di trading o di altro tipo fornite o approvate da TradingView. Per ulteriori informazioni, consultare i Termini di utilizzo.