
!!!INVERTED CHART !!!
Bullish on Sand for now
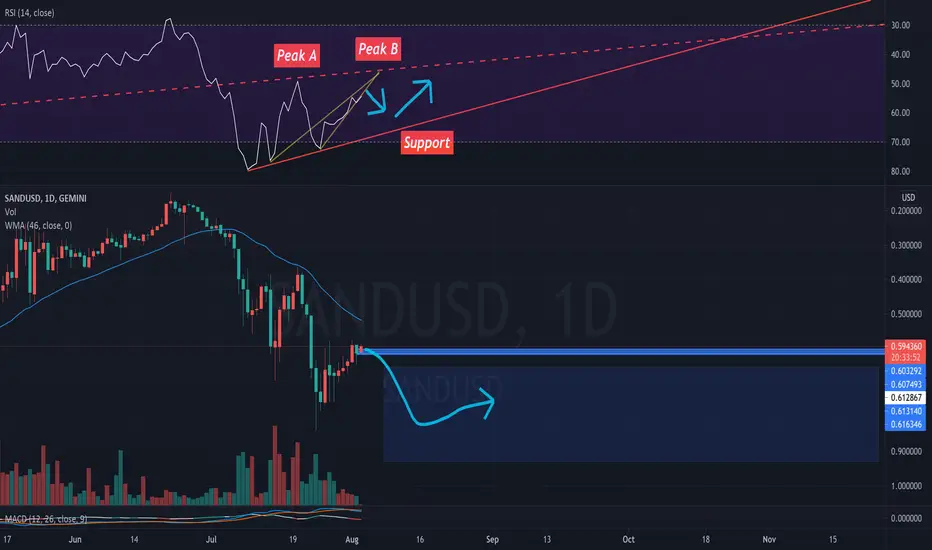
You can see that on the RSI- Peak B is very weak compared to previous Peak A.
That tells me Peak B wont reach the dash resistance line much less break it.
So I placed sell orders along the bullish blue path because I expect Peak B to bounce towards 60-70 on the RSI to the support.
Once that happens it will gain strength to test the dash resistance again which will turn bearish then...
Bullish on Sand for now
You can see that on the RSI- Peak B is very weak compared to previous Peak A.
That tells me Peak B wont reach the dash resistance line much less break it.
So I placed sell orders along the bullish blue path because I expect Peak B to bounce towards 60-70 on the RSI to the support.
Once that happens it will gain strength to test the dash resistance again which will turn bearish then...

Declinazione di responsabilità
Le informazioni e le pubblicazioni non sono intese come, e non costituiscono, consulenza o raccomandazioni finanziarie, di investimento, di trading o di altro tipo fornite o approvate da TradingView. Per ulteriori informazioni, consultare i Termini di utilizzo.
Declinazione di responsabilità
Le informazioni e le pubblicazioni non sono intese come, e non costituiscono, consulenza o raccomandazioni finanziarie, di investimento, di trading o di altro tipo fornite o approvate da TradingView. Per ulteriori informazioni, consultare i Termini di utilizzo.