
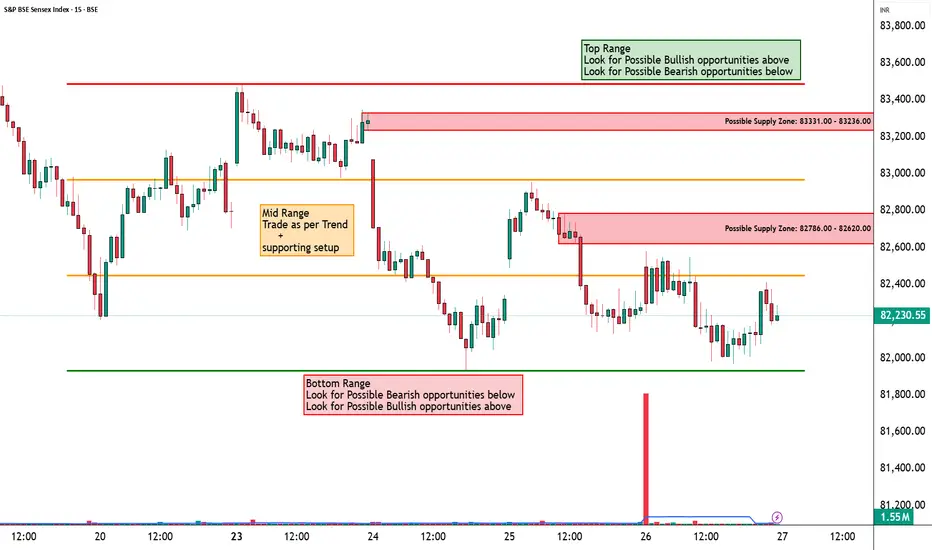
📊 Sensex Analysis – 27 February 2026
(Simple Chart Reading)
CMP: 82,230
Current Structure: Downtrend on daily chart | Short-term sideways to slightly weak
Market Mood: Mildly negative near resistance
________________________________________
What the Chart Shows
Price is trading below 82,561 and 82,874, which may act as resistance.
Stronger resistance is placed near 83,170 and higher near 83,300–83,600 zone.
Immediate support is around 81,953.
Next supports are near 81,657 and 81,344.
Recent candles show selling pressure near resistance areas.
Momentum appears weak on daily chart, while intraday movement remains inside a range.
Sensex is attempting small recoveries but remains below strong resistance zones.
________________________________________
Important Levels for Intraday
Support:
81,953 | 81,657 | 81,344
Resistance:
82,561 | 82,874 | 83,170
Possible Demand & Supply Zones:
Supply Zone: 82,786 – 82,874
Strong Supply Zone: 83,300 – 83,600
________________________________________
Possible Opening Scenarios
If Market Opens Higher (Gap Up)
Opens Above 82,561
Possible Upside Movement:
Price may move towards 82,874.
If strength continues, extension towards 83,170 may be possible.
From Where Can Price Fall?
Rejection may begin near 82,874.
Stronger rejection may appear near 83,170 or higher supply zone.
If Price Falls After Gap Up, It May Reach:
First pullback zone → 82,600–82,500
Further weakness → 81,953
Extended pressure → 81,657
Gap up into resistance may increase pullback probability.
________________________________________
Opens Directly Near 82,874–83,170
Upside Possibility:
A brief push towards 83,170 may occur if buying remains strong.
Reversal Possibility:
Selling pressure may appear inside this supply zone.
If Reversal Happens, Price May Fall Towards:
82,874
Then 82,561
If weakness builds → 81,953
________________________________________
If Market Opens Lower (Gap Down)
Opens Near 81,953
Possible Downside Movement:
Price may move towards 81,657.
Continued weakness may extend towards 81,344.
From Where Can Price Rise?
Bounce may begin near 81,657.
Stronger demand may appear near 81,344.
If Price Rises After Gap Down, It May Reach:
First recovery zone → 81,953
If recovery strengthens → 82,300–82,500
Strong recovery → 82,561
________________________________________
Opens Below 81,953
Immediate Downside Possibility:
Move towards 81,657
Further pressure → 81,344
If Recovery Starts, Upside May Reach:
Back towards 81,953
If sustained above → 82,561
Gap down into support may increase bounce probability.
________________________________________
If Market Moves Sideways (Range-Bound Day)
Likely Range:
81,953 – 82,561
Extended Range:
81,657 – 82,874
If price stays inside this band:
Movement may continue between support and resistance.
Breakouts may fail.
Volume may reduce.
No strong control from buyers or sellers.
Price Action at Lower Band (81,953)
Buying interest may push price towards 82,300–82,561.
Break below may open move towards 81,657.
Price Action at Upper Band (82,561)
Rejection may bring pullback towards 82,200–81,953.
Strong breakout may open move towards 82,874.
Balanced movement suggests market is waiting for direction.
________________________________________
Overall Picture
Daily chart shows weakness and lower highs.
Intraday (15-min) chart shows sideways movement near mid-range.
Strong resistance is placed in the 82,800–83,300 zone.
Important support is near 81,950.
A larger directional move may develop once price breaks clearly beyond this range.
________________________________________
STWP View
Market appears to be consolidating below resistance.
Upside possibilities may improve above 82,874–83,170.
Downside pressure may increase below 81,953–81,657.
If levels continue to hold, range-bound movement may continue.
The first hour may provide early clues about strength or weakness.
________________________________________
⚠️ Disclaimer
This post is intended solely for educational and informational purposes. It does not constitute investment advice, a recommendation, or a solicitation to buy or sell any security. Market investments are subject to risk. Please consult a SEBI-registered financial advisor before making any investment decisions. STWP is not responsible for actions taken based on this analysis.
(Simple Chart Reading)
CMP: 82,230
Current Structure: Downtrend on daily chart | Short-term sideways to slightly weak
Market Mood: Mildly negative near resistance
________________________________________
What the Chart Shows
Price is trading below 82,561 and 82,874, which may act as resistance.
Stronger resistance is placed near 83,170 and higher near 83,300–83,600 zone.
Immediate support is around 81,953.
Next supports are near 81,657 and 81,344.
Recent candles show selling pressure near resistance areas.
Momentum appears weak on daily chart, while intraday movement remains inside a range.
Sensex is attempting small recoveries but remains below strong resistance zones.
________________________________________
Important Levels for Intraday
Support:
81,953 | 81,657 | 81,344
Resistance:
82,561 | 82,874 | 83,170
Possible Demand & Supply Zones:
Supply Zone: 82,786 – 82,874
Strong Supply Zone: 83,300 – 83,600
________________________________________
Possible Opening Scenarios
If Market Opens Higher (Gap Up)
Opens Above 82,561
Possible Upside Movement:
Price may move towards 82,874.
If strength continues, extension towards 83,170 may be possible.
From Where Can Price Fall?
Rejection may begin near 82,874.
Stronger rejection may appear near 83,170 or higher supply zone.
If Price Falls After Gap Up, It May Reach:
First pullback zone → 82,600–82,500
Further weakness → 81,953
Extended pressure → 81,657
Gap up into resistance may increase pullback probability.
________________________________________
Opens Directly Near 82,874–83,170
Upside Possibility:
A brief push towards 83,170 may occur if buying remains strong.
Reversal Possibility:
Selling pressure may appear inside this supply zone.
If Reversal Happens, Price May Fall Towards:
82,874
Then 82,561
If weakness builds → 81,953
________________________________________
If Market Opens Lower (Gap Down)
Opens Near 81,953
Possible Downside Movement:
Price may move towards 81,657.
Continued weakness may extend towards 81,344.
From Where Can Price Rise?
Bounce may begin near 81,657.
Stronger demand may appear near 81,344.
If Price Rises After Gap Down, It May Reach:
First recovery zone → 81,953
If recovery strengthens → 82,300–82,500
Strong recovery → 82,561
________________________________________
Opens Below 81,953
Immediate Downside Possibility:
Move towards 81,657
Further pressure → 81,344
If Recovery Starts, Upside May Reach:
Back towards 81,953
If sustained above → 82,561
Gap down into support may increase bounce probability.
________________________________________
If Market Moves Sideways (Range-Bound Day)
Likely Range:
81,953 – 82,561
Extended Range:
81,657 – 82,874
If price stays inside this band:
Movement may continue between support and resistance.
Breakouts may fail.
Volume may reduce.
No strong control from buyers or sellers.
Price Action at Lower Band (81,953)
Buying interest may push price towards 82,300–82,561.
Break below may open move towards 81,657.
Price Action at Upper Band (82,561)
Rejection may bring pullback towards 82,200–81,953.
Strong breakout may open move towards 82,874.
Balanced movement suggests market is waiting for direction.
________________________________________
Overall Picture
Daily chart shows weakness and lower highs.
Intraday (15-min) chart shows sideways movement near mid-range.
Strong resistance is placed in the 82,800–83,300 zone.
Important support is near 81,950.
A larger directional move may develop once price breaks clearly beyond this range.
________________________________________
STWP View
Market appears to be consolidating below resistance.
Upside possibilities may improve above 82,874–83,170.
Downside pressure may increase below 81,953–81,657.
If levels continue to hold, range-bound movement may continue.
The first hour may provide early clues about strength or weakness.
________________________________________
⚠️ Disclaimer
This post is intended solely for educational and informational purposes. It does not constitute investment advice, a recommendation, or a solicitation to buy or sell any security. Market investments are subject to risk. Please consult a SEBI-registered financial advisor before making any investment decisions. STWP is not responsible for actions taken based on this analysis.

STWP | Mentor & Demand-Supply Specialist |
Empowering traders through structured learning |
simpletradewithpatience.com
Community: chat.whatsapp.com/BEYz0tkqP0fJPBCWf59uel
wa.me/message/6IOPHGOXMGZ4N1
Educational Only
Empowering traders through structured learning |
simpletradewithpatience.com
Community: chat.whatsapp.com/BEYz0tkqP0fJPBCWf59uel
wa.me/message/6IOPHGOXMGZ4N1
Educational Only
Declinazione di responsabilità
Le informazioni e le pubblicazioni non sono intese come, e non costituiscono, consulenza o raccomandazioni finanziarie, di investimento, di trading o di altro tipo fornite o approvate da TradingView. Per ulteriori informazioni, consultare i Termini di utilizzo.
STWP | Mentor & Demand-Supply Specialist |
Empowering traders through structured learning |
simpletradewithpatience.com
Community: chat.whatsapp.com/BEYz0tkqP0fJPBCWf59uel
wa.me/message/6IOPHGOXMGZ4N1
Educational Only
Empowering traders through structured learning |
simpletradewithpatience.com
Community: chat.whatsapp.com/BEYz0tkqP0fJPBCWf59uel
wa.me/message/6IOPHGOXMGZ4N1
Educational Only
Declinazione di responsabilità
Le informazioni e le pubblicazioni non sono intese come, e non costituiscono, consulenza o raccomandazioni finanziarie, di investimento, di trading o di altro tipo fornite o approvate da TradingView. Per ulteriori informazioni, consultare i Termini di utilizzo.