
Shiba Inu (SHIB) technical analysis:
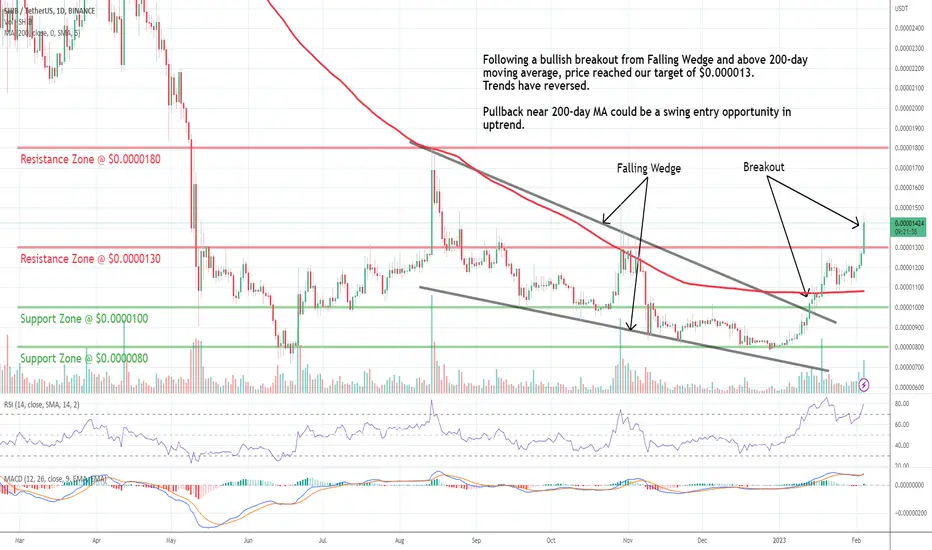
Trade setup: Following a bullish breakout from Falling Wedge and above 200-day moving average, price also broke above $0.000013 resistance. Trends have reversed. Upside potential to $0.000018 next.
Trend: Uptrend across all time horizons (Short- Medium- and Long-Term).
Momentum is Bullish but extremely overbought. ( MACD Line is above MACD Signal Line). RSI is bullish (> 55) but extremely overbought (> 80) which could imply that price could briefly pause or pull back if it reaches Resistance.
Support and Resistance: Nearest Support Zone is $0.0000100 (previous resistance), then $0.0000080. The nearest Resistance Zone is $0.0000130, which it broke, then $0.0000180.
Trade setup: Following a bullish breakout from Falling Wedge and above 200-day moving average, price also broke above $0.000013 resistance. Trends have reversed. Upside potential to $0.000018 next.
Trend: Uptrend across all time horizons (Short- Medium- and Long-Term).
Momentum is Bullish but extremely overbought. ( MACD Line is above MACD Signal Line). RSI is bullish (> 55) but extremely overbought (> 80) which could imply that price could briefly pause or pull back if it reaches Resistance.
Support and Resistance: Nearest Support Zone is $0.0000100 (previous resistance), then $0.0000080. The nearest Resistance Zone is $0.0000130, which it broke, then $0.0000180.

Declinazione di responsabilità
Le informazioni e le pubblicazioni non sono intese come, e non costituiscono, consulenza o raccomandazioni finanziarie, di investimento, di trading o di altro tipo fornite o approvate da TradingView. Per ulteriori informazioni, consultare i Termini di utilizzo.
Declinazione di responsabilità
Le informazioni e le pubblicazioni non sono intese come, e non costituiscono, consulenza o raccomandazioni finanziarie, di investimento, di trading o di altro tipo fornite o approvate da TradingView. Per ulteriori informazioni, consultare i Termini di utilizzo.