SHOPIFY Bottom Potential
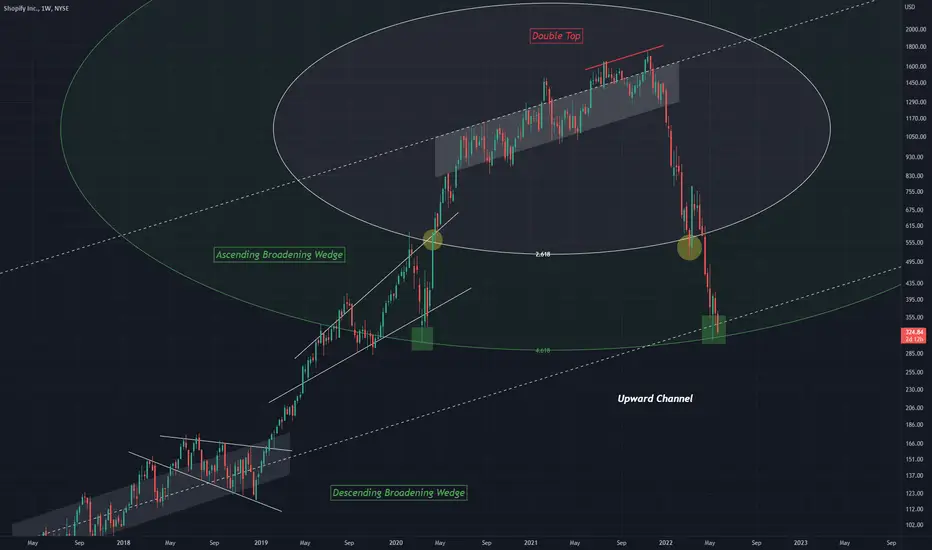
An upward channel can be drawn from a strong trend line point on SHOPIFY
It provides a chart like this, showing a clear top, and also a potential bottom that aligns with the 4.618 fib
An attempted support can be seen to have formed at 2.618 (yellow)
This leaves 4.618 as a bottom point, which has also been seen as a bottom in the past (green)
Two bullish chart patterns can be seen on chart along with one bearish
Ascending and Descending wedge both acting bullishly
Followed by a Double top, considered a bearish pattern
It provides a chart like this, showing a clear top, and also a potential bottom that aligns with the 4.618 fib
An attempted support can be seen to have formed at 2.618 (yellow)
This leaves 4.618 as a bottom point, which has also been seen as a bottom in the past (green)
Two bullish chart patterns can be seen on chart along with one bearish
Ascending and Descending wedge both acting bullishly
Followed by a Double top, considered a bearish pattern

Declinazione di responsabilità
Le informazioni e le pubblicazioni non sono intese come, e non costituiscono, consulenza o raccomandazioni finanziarie, di investimento, di trading o di altro tipo fornite o approvate da TradingView. Per ulteriori informazioni, consultare i Termini di utilizzo.
Declinazione di responsabilità
Le informazioni e le pubblicazioni non sono intese come, e non costituiscono, consulenza o raccomandazioni finanziarie, di investimento, di trading o di altro tipo fornite o approvate da TradingView. Per ulteriori informazioni, consultare i Termini di utilizzo.