
Bearish Counter-Analysis:
1. Resistance Zone Saturation:
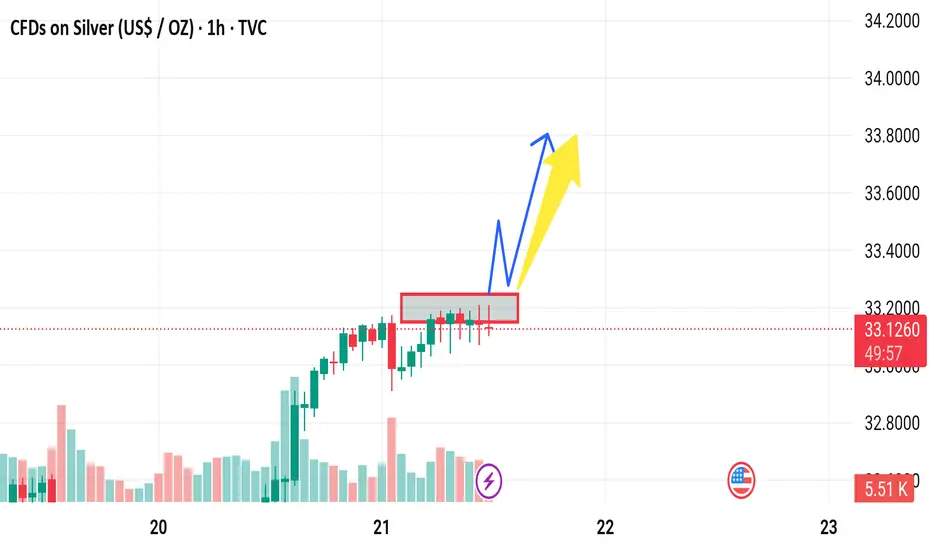
The red box shows repeated tests of the resistance area around $33.14–$33.20. This can suggest exhaustion instead of momentum.
Multiple failed attempts to break this zone can result in bearish rejection.
2. Volume Divergence:
The volume appears to be declining even as price approaches resistance. This divergence can imply a lack of buyer strength, which is a red flag for a bullish continuation.
3. Possible Bull Trap:
A sharp move above resistance followed by a quick drop back inside (false breakout) could trap long traders.
This may be followed by a sharp sell-off toward the previous support level (~$32.60–$32.80).
4. Candlestick Patterns:
Watch closely for bearish candlestick patterns like doji, shooting star, or bearish engulfing in the red box. Their appearance would strengthen a bearish reversal case.
5. MACD/RSI (if available):
If the RSI is overbought or MACD shows a bearish crossover, it would reinforce the possibility of a downward retracement.
1. Resistance Zone Saturation:
The red box shows repeated tests of the resistance area around $33.14–$33.20. This can suggest exhaustion instead of momentum.
Multiple failed attempts to break this zone can result in bearish rejection.
2. Volume Divergence:
The volume appears to be declining even as price approaches resistance. This divergence can imply a lack of buyer strength, which is a red flag for a bullish continuation.
3. Possible Bull Trap:
A sharp move above resistance followed by a quick drop back inside (false breakout) could trap long traders.
This may be followed by a sharp sell-off toward the previous support level (~$32.60–$32.80).
4. Candlestick Patterns:
Watch closely for bearish candlestick patterns like doji, shooting star, or bearish engulfing in the red box. Their appearance would strengthen a bearish reversal case.
5. MACD/RSI (if available):
If the RSI is overbought or MACD shows a bearish crossover, it would reinforce the possibility of a downward retracement.

Declinazione di responsabilità
Le informazioni e le pubblicazioni non sono intese come, e non costituiscono, consulenza o raccomandazioni finanziarie, di investimento, di trading o di altro tipo fornite o approvate da TradingView. Per ulteriori informazioni, consultare i Termini di utilizzo.
Declinazione di responsabilità
Le informazioni e le pubblicazioni non sono intese come, e non costituiscono, consulenza o raccomandazioni finanziarie, di investimento, di trading o di altro tipo fornite o approvate da TradingView. Per ulteriori informazioni, consultare i Termini di utilizzo.