
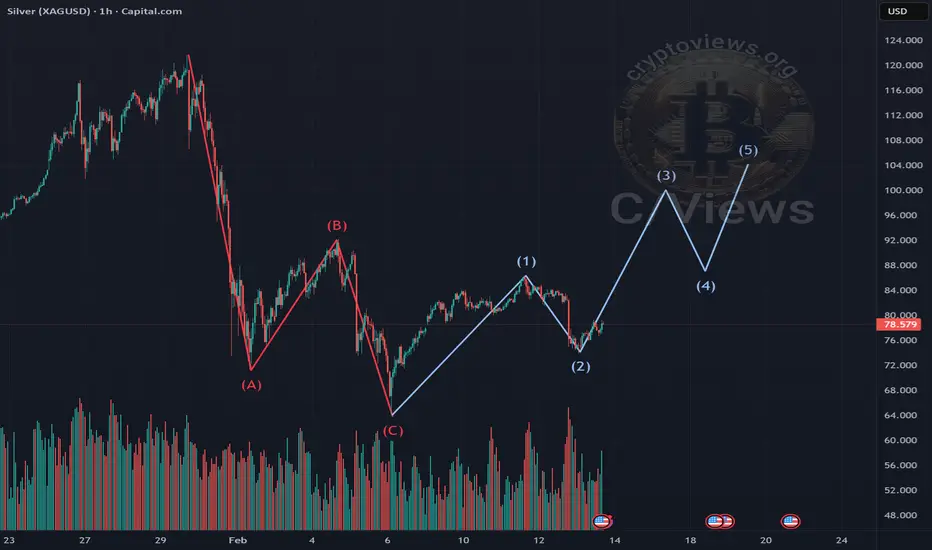
XAG (SILVER) - after the ABC correction, the asset fell by almost 50%.
The market stalled, and the first and second Elliott waves formed on the chart.
A rebound from the 50% Fibonacci level is also visible - this most likely indicates the end of the correction.
A potential third wave of growth is currently forming, this wave is also typically the most impulsive.
If the price falls below the bottom of the second wave, the wave structure will be broken, and the price may go lower.
Full breakdown with levels and graphs on the website
The market stalled, and the first and second Elliott waves formed on the chart.
A rebound from the 50% Fibonacci level is also visible - this most likely indicates the end of the correction.
A potential third wave of growth is currently forming, this wave is also typically the most impulsive.
If the price falls below the bottom of the second wave, the wave structure will be broken, and the price may go lower.
Full breakdown with levels and graphs on the website

Declinazione di responsabilità
Le informazioni e le pubblicazioni non sono intese come, e non costituiscono, consulenza o raccomandazioni finanziarie, di investimento, di trading o di altro tipo fornite o approvate da TradingView. Per ulteriori informazioni, consultare i Termini di utilizzo.
Declinazione di responsabilità
Le informazioni e le pubblicazioni non sono intese come, e non costituiscono, consulenza o raccomandazioni finanziarie, di investimento, di trading o di altro tipo fornite o approvate da TradingView. Per ulteriori informazioni, consultare i Termini di utilizzo.