
What's good, crypto fam! 🚀
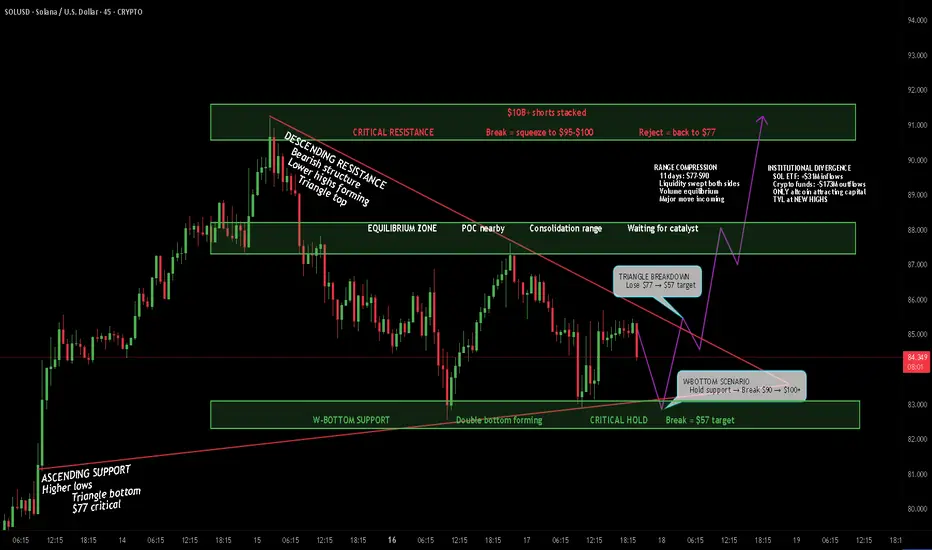
Solana is at a CRITICAL decision point right now. We've got range compression, a descending triangle pattern, and potential W-bottom formation all happening at once. Let me break down what's happening on the 45-minute chart and why the next move could be MASSIVE.
The Setup
SOLUSD is trading at $84.50 after consolidating in a tight $77-$90 range for the past 11 days. Price is squeezed between descending resistance (bearish structure) and rising support (bullish defense). We're seeing a classic compression pattern - the calm before the storm.
The big question: Does this resolve with a W-bottom reversal to $100+, or do we break down to $57?
Why This Setup Matters
- 11 days of range compression ($77-$90) - liquidity swept both sides
- Descending triangle pattern (typically bearish continuation)
- BUT - potential W-bottom forming at $77-$82 support
- Volume equilibrium = major move incoming
- $90-$92 resistance has $10B+ in short liquidations stacked
- Trading below Point of Control (POC) = slight bearish bias
- Wyckoff Reaccumulation pattern potentially in Phase D
The News Context - February 17, 2026
This is where it gets interesting - fundamentals vs technicals battle:
Bullish catalysts:
- Solana ETF inflows $31M weekly (ONLY altcoin attracting capital)
- Broader crypto funds lost $173M - SOL bucking the trend
- Total Value Locked hit NEW HIGHS despite price weakness
- Institutional experimentation expanding on Solana
- Network growth metrics remain strong
- Wyckoff reaccumulation suggests Spring at $68 completed
- Late shorts trapped around $95 (liquidation fuel above $90)
Bearish/Risk factors:
- SOL down 40% in past 30 days (dropped below $100 psychological)
- Transaction volumes spiked to 230.5M (12-month high) = cascade liquidations
- Weekly Doji Star formed = potential bearish continuation
- OBV trending sharply lower = weak buying pressure
- Trading below POC = bearish short-term bias
- Descending triangle = typically bearish pattern
- Analyst target $57 if range breaks down
- Similar pattern previously caused $250 → $125 drop
- Bitcoin marking 5th consecutive monthly loss (macro weakness)
- Fear & Greed Index at record low of 5 (extreme fear)
Key Levels I'm Watching
Resistance:
- $88 - Rising channel resistance / immediate ceiling
- $90-$92 - CRITICAL RESISTANCE ZONE (must break for bulls)
- $95 - Short liquidation cluster ($10B+)
- $100 - Psychological level / major breakout confirmation
- $102 - Extended target if breakout
- $118 - Key technical level (previous support turned resistance)
Support:
- $85 - Current price / 100-hour SMA
- $82 - First major support / 61.8% Fib
- $77-$82 - W-BOTTOM SUPPORT ZONE (critical hold)
- $76.50 - Danger zone if broken
- $72 - Extended support
- $68 - Wyckoff Spring low (must hold long-term)
- $57 - Analyst target if breakdown
- $50 - Major support if macro deteriorates
Pattern Analysis - Three Scenarios
SCENARIO 1: W-Bottom Reversal (BULLISH)
The $77-$82 zone has held twice, forming a potential W-bottom (double bottom). If this plays out:
- First bottom: $77 (left side of W)
- Second bottom: $77-$82 (right side of W - current)
- Neckline: $90-$92 resistance
- Target: $100-$118 (measured move from neckline)
Triggers: Hold $77-$82 support, break above $90-$92 with volume, short squeeze to $95-$100.
This aligns with Wyckoff Reaccumulation Phase D - if SOL holds above $95, we get Sign of Strength (SOS) rally toward $150+.
SCENARIO 2: Descending Triangle Breakdown (BEARISH)
The descending resistance from highs + horizontal support at $77 forms a descending triangle (bearish continuation pattern). If this plays out:
- Break below $77 support
- Target: $57 (measured move from triangle height)
- Potential cascade to $50 if panic selling
Triggers: Lose $77 support, volume spike on breakdown, Bitcoin breaks key support, macro deterioration.
This aligns with weekly Doji Star bearish continuation - similar to previous $250 → $125 drop.
SCENARIO 3: Range Continuation (NEUTRAL)
Price continues chopping between $77-$90 until a major catalyst forces resolution. This is liquidity-driven consolidation.
- Chop between $77-$90 for days/weeks
- Low volume, tight range
- Waiting for Bitcoin direction or major news
Triggers: No major catalyst, Bitcoin sideways, continued equilibrium.
Volume & Liquidity Analysis
- Transaction volumes hit 230.5M (12-month high) when SOL dropped below $100
- This confirms $100 and $118 as critical technical levels
- $90-$92 has $10B+ in short liquidations stacked (heatmap data)
- If SOL pushes into $90-$92, shorts get squeezed → fast spike to $95-$100
- These are "late shorts" trapped above current price
- Market Makers could wipe out shorts if Bitcoin shows strength
- BUT - OBV trending lower = weak buying pressure overall
Wyckoff Reaccumulation Context
According to Wyckoff analysis, SOL may be in Phase D of reaccumulation:
- Phase A: Selling Climax at $110 (Aug 2024), Automatic Rally to $264
- Phase B: Multiple Secondary Tests, Upthrust After at $295 (fakeout)
- Phase C: Spring at $68 (early 2026) - liquidity sweep, sharp rejection
- Phase D (NOW?): Must hold above $95 for Sign of Strength rally
If Wyckoff plays out:
- Last Point of Support (LPS): $150
- Backup (BU/LPS): $250
- Markup phase: $350-$500+
BUT this requires SOL to defend $77-$82 and break above $95 with conviction.
My Game Plan
Bullish scenario: If SOL holds the $77-$82 W-bottom support and breaks above $90-$92 with volume, we could see a rapid short squeeze to $95-$100. The ETF inflows are REAL ($31M weekly while everything else bleeds), and institutional interest is building. If Bitcoin stabilizes and SOL reclaims $95, the Wyckoff reaccumulation thesis activates → target $118, then $150+.
Bearish scenario: If we lose $77 support, the descending triangle completes and we're heading to $57. The weekly Doji Star + declining OBV + macro weakness (Bitcoin 5th red month, Fear Index at 5) suggest more pain possible. Transaction volume spike at $100 breakdown = cascade liquidations. Break $77 = danger zone.
Most likely scenario: I think we chop between $77-$90 for a bit longer while Bitcoin decides direction. The $90-$92 level is LOADED with shorts ($10B+), so any push there triggers volatility. Watch for volume spike - that's your signal. If we hold $77 = accumulation. If we break $77 = run.
The Bottom Line
I'm NEUTRAL with a slight BULLISH bias on fundamentals but CAUTIOUS on technicals.
The fundamentals are strong:
- ONLY altcoin with positive ETF inflows ($31M)
- TVL at new highs despite price weakness
- Institutional interest growing
- Wyckoff reaccumulation potentially setting up
BUT the technicals are weak:
- Descending triangle (bearish pattern)
- Trading below POC
- OBV declining
- Macro environment brutal (Bitcoin 5th red month)
The $77-$82 support zone is EVERYTHING. Hold = W-bottom to $100+. Break = Triangle breakdown to $57.
The $90-$92 resistance is the KEY. Break above = short squeeze to $95-$100+. Reject = back to $77.
What do you think? W-bottom reversal or triangle breakdown? Drop your take! 👇
If this helped, smash that 🚀 Boost button!
Not financial advice. DYOR.

The AI Trading Ecosystem, Built to win trades 📈
Get Full Access 👇
jackofalltrades.vip 🌐
t.me/jackofalltradesvip 🃏
Get Full Access 👇
jackofalltrades.vip 🌐
t.me/jackofalltradesvip 🃏
Declinazione di responsabilità
Le informazioni e le pubblicazioni non sono intese come, e non costituiscono, consulenza o raccomandazioni finanziarie, di investimento, di trading o di altro tipo fornite o approvate da TradingView. Per ulteriori informazioni, consultare i Termini di utilizzo.
The AI Trading Ecosystem, Built to win trades 📈
Get Full Access 👇
jackofalltrades.vip 🌐
t.me/jackofalltradesvip 🃏
Get Full Access 👇
jackofalltrades.vip 🌐
t.me/jackofalltradesvip 🃏
Declinazione di responsabilità
Le informazioni e le pubblicazioni non sono intese come, e non costituiscono, consulenza o raccomandazioni finanziarie, di investimento, di trading o di altro tipo fornite o approvate da TradingView. Per ulteriori informazioni, consultare i Termini di utilizzo.