
Generated: 2026-03-25 10:17 ET
🔴 Solana (SOL/USD) — Multi-Timeframe Bear Case Building Toward April
Solana has been grinding through a brutal structural decline since its September 2025 highs, and the weight of evidence across monthly, weekly, and daily timeframes continues to favor the bear camp. Here's the current read.
📅 Timing: A Rare Convergence Window
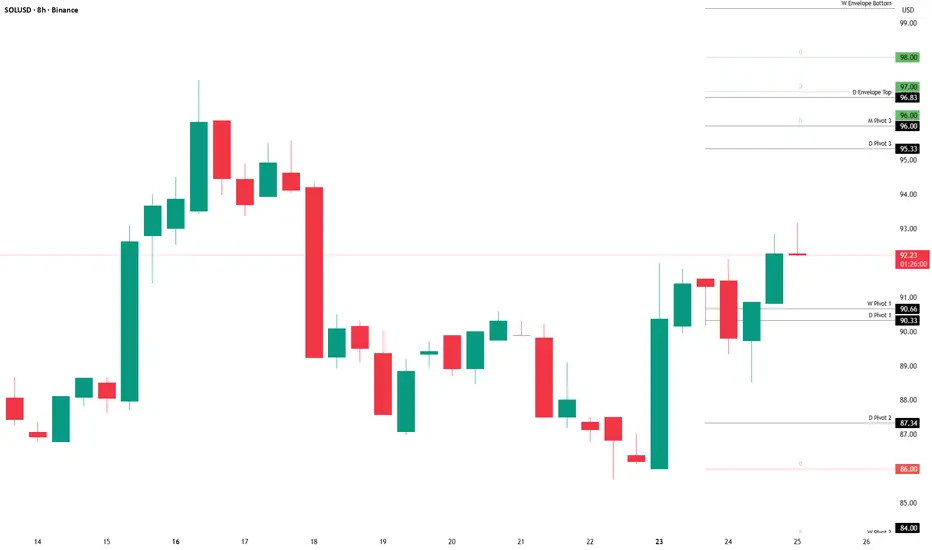
Today, March 25, is flagged as a high-probability turning point on the daily timeframe — with no fewer than 9 independent Fibonacci time measurements converging on this exact date alongside the Socrates timing array's directional change signal (a combined strength reading of 12, one of the strongest multi-system confluences seen in recent sessions). Price spiked intraday to $93.25 from an $90.82 open, which looks less like a breakout and more like an exhaustion move into a resistance cluster.
The daily array also warns of a choppy, alternating 4-day period from March 24–27, with each session tending to reverse the prior day's direction. Monday closed lower, Tuesday/Wednesday bounced — the setup tilts toward resumption of downside from here through Thursday.
On the weekly timeframe, the timing array flagged the week of March 23 as a turning point, with the opposite trend implied into the week of March 30. The strongest weekly target remains April 27, suggesting the primary downside move likely plays out over the next several weeks.
Monthly timing reinforces this: the April window is the strongest monthly target and appears to be the gravitational destination for this entire bear phase.
🧱 Reversal Structure: Bears Have the Building, Bulls Have Nothing
The reversal picture is as lopsided as it gets:
- Monthly: 5 bearish reversals elected in cascade since early 2025. Zero active monthly bullish reversals. The next active monthly level is a bearish $80.00 (4 sig).
- Weekly: 10 bearish reversals elected. Zero active weekly bullish reversals. The next active weekly level is a bearish $79.00 (4 Maj).
- Daily: Price testing $93, which is itself the site of a previously elected weekly bearish reversal — now acting as overhead resistance rather than support.
The $79–$80 zone represents convergence of the nearest active reversal levels on both the monthly and weekly charts. A sustained move into that area would satisfy the primary structural target 📌
📊 Momentum & Indicators
Monthly stochastics remain in what technicians might recognize as a "crash pattern" — the slow red line sitting well above blue and yellow at ~28 vs. ~10 and ~14, with no upward cross forming. Weekly momentum, while briefly showing a bullish stochastic cross, is doing so from deeply compressed levels with negative energy models — a setup that historically lacks follow-through in the context of such heavy reversal overhead. The weekly GMW model reads "Turning BACK DOWN," confirming the weekly trend is resuming lower from any near-term bounce.
⚠️ What Would Change This Outlook?
The bearish case weakens materially if SOL can achieve a sustained daily close above $96.00 — the nearest unelected daily bullish reversal. A push through there, combined with weekly stochastic expansion, would suggest the bounce has more structural credibility than current evidence supports. Monthly energy models are also showing a potential divergence (energy rising while price makes new lows), which is worth monitoring — if confirmed across additional months, it could signal the depth of decline is limited.
Summary 🎯
The convergence of monthly, weekly, and daily signals leans bearish into April. Resistance near $93–$96 appears formidable. The $79–$80 zone is the high-probability structural target over the next 4–6 weeks if current conditions hold. Timing models flag late March and late April as the key inflection windows to watch.
This is not a certainty — it's a probability setup. Manage risk accordingly.
🔴 Solana (SOL/USD) — Multi-Timeframe Bear Case Building Toward April
Solana has been grinding through a brutal structural decline since its September 2025 highs, and the weight of evidence across monthly, weekly, and daily timeframes continues to favor the bear camp. Here's the current read.
📅 Timing: A Rare Convergence Window
Today, March 25, is flagged as a high-probability turning point on the daily timeframe — with no fewer than 9 independent Fibonacci time measurements converging on this exact date alongside the Socrates timing array's directional change signal (a combined strength reading of 12, one of the strongest multi-system confluences seen in recent sessions). Price spiked intraday to $93.25 from an $90.82 open, which looks less like a breakout and more like an exhaustion move into a resistance cluster.
The daily array also warns of a choppy, alternating 4-day period from March 24–27, with each session tending to reverse the prior day's direction. Monday closed lower, Tuesday/Wednesday bounced — the setup tilts toward resumption of downside from here through Thursday.
On the weekly timeframe, the timing array flagged the week of March 23 as a turning point, with the opposite trend implied into the week of March 30. The strongest weekly target remains April 27, suggesting the primary downside move likely plays out over the next several weeks.
Monthly timing reinforces this: the April window is the strongest monthly target and appears to be the gravitational destination for this entire bear phase.
🧱 Reversal Structure: Bears Have the Building, Bulls Have Nothing
The reversal picture is as lopsided as it gets:
- Monthly: 5 bearish reversals elected in cascade since early 2025. Zero active monthly bullish reversals. The next active monthly level is a bearish $80.00 (4 sig).
- Weekly: 10 bearish reversals elected. Zero active weekly bullish reversals. The next active weekly level is a bearish $79.00 (4 Maj).
- Daily: Price testing $93, which is itself the site of a previously elected weekly bearish reversal — now acting as overhead resistance rather than support.
The $79–$80 zone represents convergence of the nearest active reversal levels on both the monthly and weekly charts. A sustained move into that area would satisfy the primary structural target 📌
📊 Momentum & Indicators
Monthly stochastics remain in what technicians might recognize as a "crash pattern" — the slow red line sitting well above blue and yellow at ~28 vs. ~10 and ~14, with no upward cross forming. Weekly momentum, while briefly showing a bullish stochastic cross, is doing so from deeply compressed levels with negative energy models — a setup that historically lacks follow-through in the context of such heavy reversal overhead. The weekly GMW model reads "Turning BACK DOWN," confirming the weekly trend is resuming lower from any near-term bounce.
⚠️ What Would Change This Outlook?
The bearish case weakens materially if SOL can achieve a sustained daily close above $96.00 — the nearest unelected daily bullish reversal. A push through there, combined with weekly stochastic expansion, would suggest the bounce has more structural credibility than current evidence supports. Monthly energy models are also showing a potential divergence (energy rising while price makes new lows), which is worth monitoring — if confirmed across additional months, it could signal the depth of decline is limited.
Summary 🎯
The convergence of monthly, weekly, and daily signals leans bearish into April. Resistance near $93–$96 appears formidable. The $79–$80 zone is the high-probability structural target over the next 4–6 weeks if current conditions hold. Timing models flag late March and late April as the key inflection windows to watch.
This is not a certainty — it's a probability setup. Manage risk accordingly.

Declinazione di responsabilità
Le informazioni e le pubblicazioni non sono intese come, e non costituiscono, consulenza o raccomandazioni finanziarie, di investimento, di trading o di altro tipo fornite o approvate da TradingView. Per ulteriori informazioni, consultare i Termini di utilizzo.
Declinazione di responsabilità
Le informazioni e le pubblicazioni non sono intese come, e non costituiscono, consulenza o raccomandazioni finanziarie, di investimento, di trading o di altro tipo fornite o approvate da TradingView. Per ulteriori informazioni, consultare i Termini di utilizzo.