
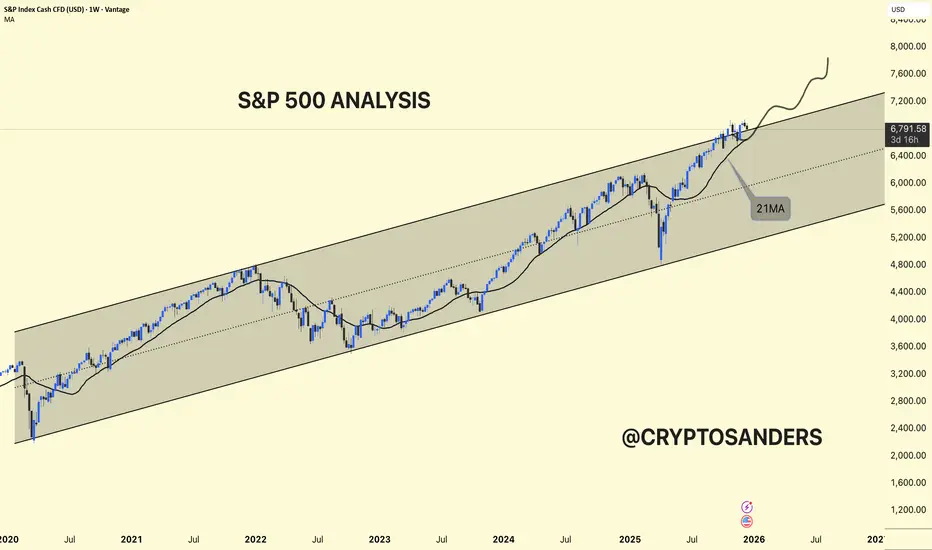
S&P 500 Chart Analysis.
The S&P 500 index is still trading within a long-term ascending channel, indicating overall market strength.
The price is currently near the upper trendline, keeping the market in bullish territory.
The index recently found support near the 21-week moving average (21 MA), which is a strong dynamic support level.
If the price remains above the 21 MA, the index could move higher and attempt to make new highs.
If the price closes weakly below the 21 MA, it could retrace towards the middle or lower part of the channel.
The trend remains bullish, but some caution is advised at these elevated levels. As long as support holds, the bullish momentum is likely to continue.
⚠️ Exercise caution.

Pubblicazioni correlate
Declinazione di responsabilità
Le informazioni e le pubblicazioni non sono intese come, e non costituiscono, consulenza o raccomandazioni finanziarie, di investimento, di trading o di altro tipo fornite o approvate da TradingView. Per ulteriori informazioni, consultare i Termini di utilizzo.