
SPCX: Pure Price Action, Trading the Post-IPO Fibonacci Levels
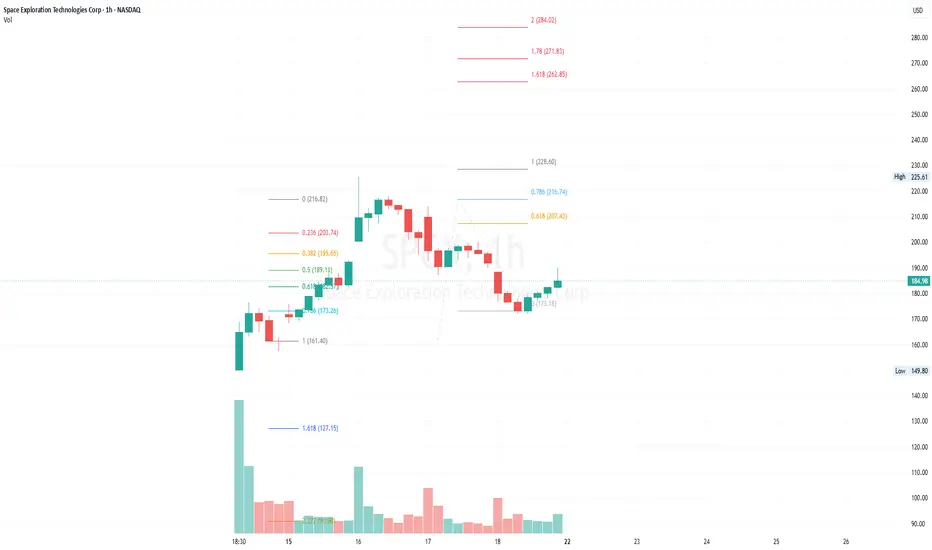
Following its massive initial public offering (IPO) last week, Space Exploration Technologies Corp is officially trading on the NASDAQ, presenting a fresh canvas for purely technical plays.
Keeping it completely simple and naked on the 1-hour chart. There is no need for overcomplicated indicators or complex theories when navigating a brand-new asset's early price discovery phase.
After hitting an early peak around the $225.61 level, the price experienced a natural post-IPO cooling-off period. It found temporary support right near the $173.18 level and is currently bouncing back up toward the $185.00 region.
What to Watch Next:
By plotting a simple Fibonacci retracement/extension tool on this lower timeframe, the immediate upside targets to keep an eye on are clearly mapped out at the $216.74 (0.786) and $228.60 (1.00) levels. Beyond that, a breakout opens the door to the extension targets sitting up at $262.85 (1.618) and $284.02 (2.00).
Educational Disclaimer: This chart is for educational purposes and purely based on technical analysis, not a buy/sell call. All entries, stop-loss setups, etc are entirely subject to your own risk evaluation. The author assumes no responsibility for market volatility or potential third-party manipulation/pump-and-dump. Always DYOR. Just an ordinary trader navigating the US, Qatar, and Malaysia stock markets.
Keeping it completely simple and naked on the 1-hour chart. There is no need for overcomplicated indicators or complex theories when navigating a brand-new asset's early price discovery phase.
After hitting an early peak around the $225.61 level, the price experienced a natural post-IPO cooling-off period. It found temporary support right near the $173.18 level and is currently bouncing back up toward the $185.00 region.
What to Watch Next:
By plotting a simple Fibonacci retracement/extension tool on this lower timeframe, the immediate upside targets to keep an eye on are clearly mapped out at the $216.74 (0.786) and $228.60 (1.00) levels. Beyond that, a breakout opens the door to the extension targets sitting up at $262.85 (1.618) and $284.02 (2.00).
Educational Disclaimer: This chart is for educational purposes and purely based on technical analysis, not a buy/sell call. All entries, stop-loss setups, etc are entirely subject to your own risk evaluation. The author assumes no responsibility for market volatility or potential third-party manipulation/pump-and-dump. Always DYOR. Just an ordinary trader navigating the US, Qatar, and Malaysia stock markets.

Declinazione di responsabilità
Le informazioni e le pubblicazioni non sono intese come, e non costituiscono, consulenza o raccomandazioni finanziarie, di investimento, di trading o di altro tipo fornite o approvate da TradingView. Per ulteriori informazioni, consultare i Termini di utilizzo.
Declinazione di responsabilità
Le informazioni e le pubblicazioni non sono intese come, e non costituiscono, consulenza o raccomandazioni finanziarie, di investimento, di trading o di altro tipo fornite o approvate da TradingView. Per ulteriori informazioni, consultare i Termini di utilizzo.