
Hi guys,
I saw a lot of fake guru comparing '16/'20 with todays'.
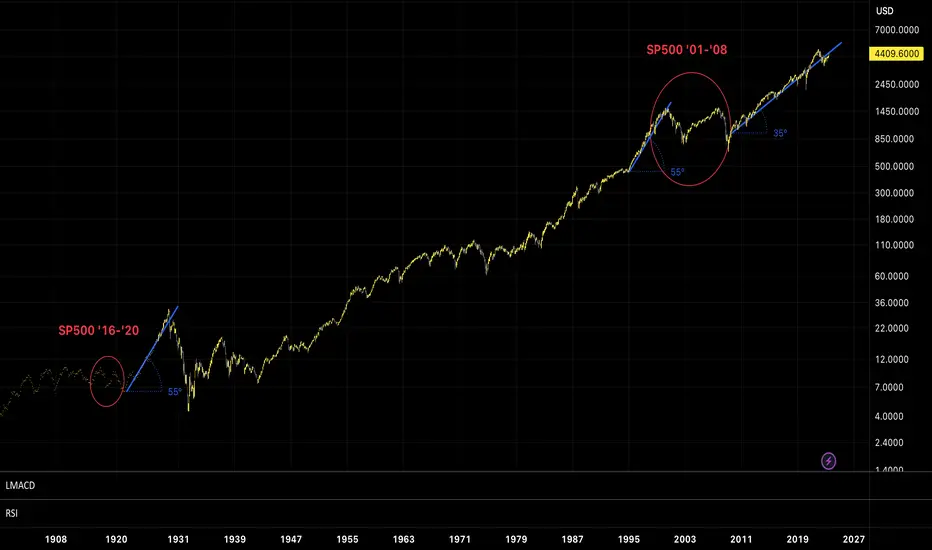
But in my mind is not true because if we compare '16/'20 with '01/'08 we all tend to agree the chart is so similar, but as u can see the rise after '08 crash is not in parabolic mode.
Could I'll be wrong? Of course, but if u find someone who compares chart randomly, unfollow immediately.
Let's see.
I saw a lot of fake guru comparing '16/'20 with todays'.
But in my mind is not true because if we compare '16/'20 with '01/'08 we all tend to agree the chart is so similar, but as u can see the rise after '08 crash is not in parabolic mode.
Could I'll be wrong? Of course, but if u find someone who compares chart randomly, unfollow immediately.
Let's see.

Pubblicazioni correlate
Declinazione di responsabilità
Le informazioni e le pubblicazioni non sono intese come, e non costituiscono, consulenza o raccomandazioni finanziarie, di investimento, di trading o di altro tipo fornite o approvate da TradingView. Per ulteriori informazioni, consultare i Termini di utilizzo.
Pubblicazioni correlate
Declinazione di responsabilità
Le informazioni e le pubblicazioni non sono intese come, e non costituiscono, consulenza o raccomandazioni finanziarie, di investimento, di trading o di altro tipo fornite o approvate da TradingView. Per ulteriori informazioni, consultare i Termini di utilizzo.