
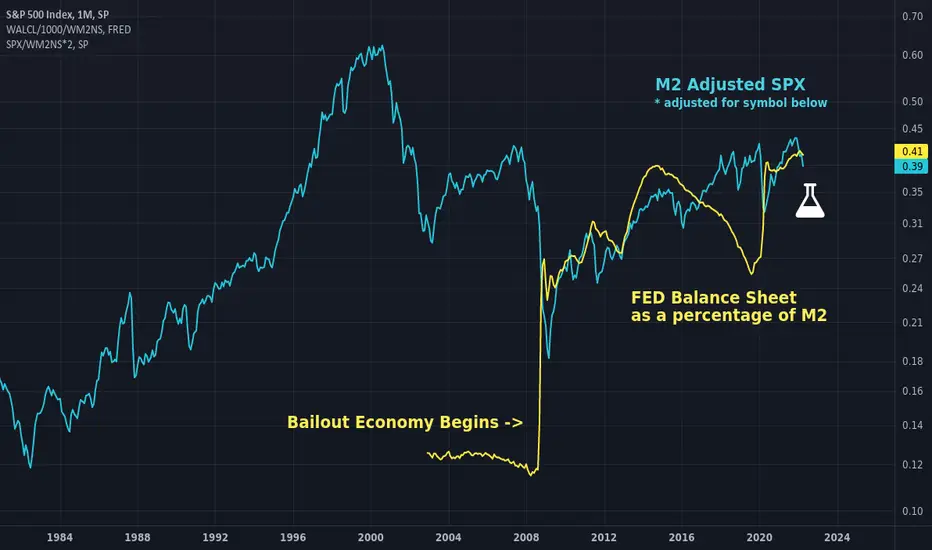
Just a combination of a couple old charts, but I wanted to make clear why assets are rising post 2008. There seems to be a direct correlation and causal relationship in FED ownership of assets as a percentage of M2 and asset prices when adjusted for M2. Lots of other charts seem to imply this by charting other things but this one shows the actual thing side by side. Perhaps the identical slope of the trend is coincidental even though the relationship is direct, it is awfully interesting though. Interpret it as you wish.
In teal: M2 adjusted SPX adjusted to overlay the symbol below.
In yellow: WALCL as a percentage of M2.
Good luck and don't forget to hedge your bets :)
In teal: M2 adjusted SPX adjusted to overlay the symbol below.
In yellow: WALCL as a percentage of M2.
Good luck and don't forget to hedge your bets :)

Declinazione di responsabilità
Le informazioni e le pubblicazioni non sono intese come, e non costituiscono, consulenza o raccomandazioni finanziarie, di investimento, di trading o di altro tipo fornite o approvate da TradingView. Per ulteriori informazioni, consultare i Termini di utilizzo.
Declinazione di responsabilità
Le informazioni e le pubblicazioni non sono intese come, e non costituiscono, consulenza o raccomandazioni finanziarie, di investimento, di trading o di altro tipo fornite o approvate da TradingView. Per ulteriori informazioni, consultare i Termini di utilizzo.