S&P 500 Index ( SPX) 4H: Contracting Wedge Apex Drives Impulse Toward $7,550 Resistance Ceiling — Dual-Breakout Framework
### 🇺🇸 USA S&P 500 Index (SPX) 4-Hour Technical Matrix (Ref: SPX_2026-07-31_08-49-17.png)
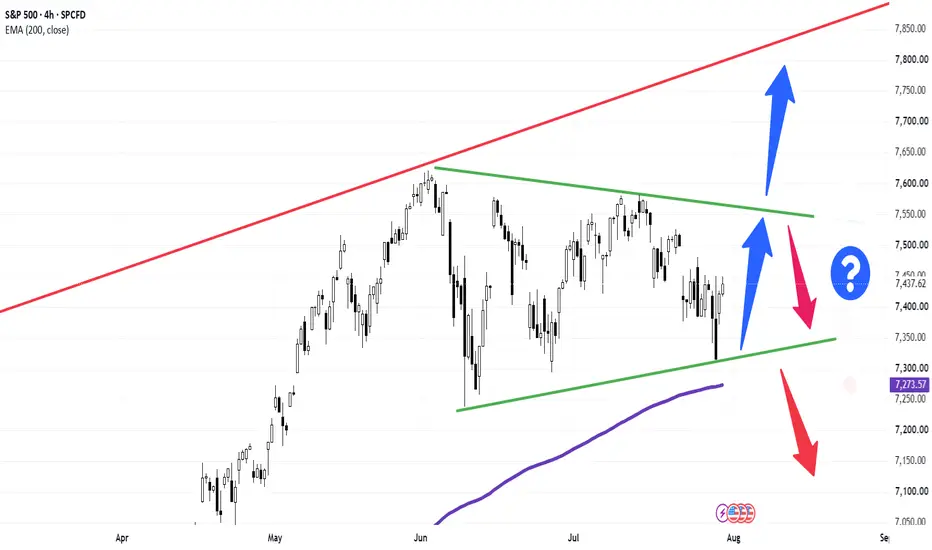
We are deploying a 4-Hour (4H) structural compression framework on the S&P 500 Index (SPX / US500). The benchmark index is currently navigating within a tight contracting wedge / symmetrical funnel geometry, springing off lower trendline support to initiate an internal leg toward the upper resistance boundary.
The index is trading with positive intraday momentum at **7,437.62 (+0.22%)**, advancing through the middle corridor of the pattern.
---
### 🔍 Technical Architecture & Funnel Mechanics:
Our quantitative framework isolates a critical decision apex defined by converging structural trendlines (green boundaries):
1. **Immediate Bullish Leg Within the Funnel (Blue Vector):** Price action is currently rebounding off the ascending support line (green LTA floor near **7,350.00**), driving an impulse leg aimed directly at testing the descending resistance trendline (green LTB ceiling around **7,550.00**).
2. **Breakout & Retest Confirmation Protocol:** As the apex tightens, the market will dictate its next macro direction based on candle closing strength outside the boundaries:
---
### 🛣️ Strategic Dual-Breakout Pathways:
* **Scenario A — Bullish Expansion to All-Time Highs (Blue Arrows):**
* **Mechanics:** A decisive 4-Hour candle close above **7,550.00** accompanied by expanding volume, followed by a successful throwback retest holding the green LTB as new support, confirms a bullish breakout. This unlocks an extended rally toward the upper macro trend channel ceiling (red resistance line) near **7,800.00 – 7,850.00**.
* **Scenario B — Rejection & Deeper Correction (Red Arrows):**
* **Mechanics:** Sell-side absorption at the **7,550.00** upper boundary will push price action back down toward the **7,350.00** support floor. A structural breakdown below this floor invalidates the wedge, triggering a deeper corrective phase toward the institutional **200-period EMA (purple line sitting at 7,273.57)** and secondary liquidity nodes near **7,150.00**.
### 📊 Tactical Parameters Summary:
* **Current Bias:** Neutral / Intraday Rebound Inside Funnel
* **Immediate Target Boundary (Wedge LTB):** ~7,550.00
* **Immediate Support Boundary (Wedge LTA):** ~7,350.00
* **Bullish Expansion Target (Red Line Ceiling):** 7,800.00 – 7,850.00
* **Institutional Risk Baseline (200-EMA):** 7,273.57
---
📊 **ChartPro Data**
*US Equity Architecture, Funnel Compression Mechanics & Systematic Risk Management.*
⚠️ **Disclaimer:** For educational and informational purposes only. This active market study represents a personal trading framework and does not constitute financial or investment advice.
SPX) 4H: Contracting Wedge Apex Drives Impulse Toward $7,550 Resistance Ceiling — Dual-Breakout Framework### 🇺🇸 USA S&P 500 Index (
SPX) 4-Hour Technical Matrix (Ref: SPX_2026-07-31_08-49-17.png)We are deploying a 4-Hour (4H) structural compression framework on the S&P 500 Index (
SPX / US500). The benchmark index is currently navigating within a tight contracting wedge / symmetrical funnel geometry, springing off lower trendline support to initiate an internal leg toward the upper resistance boundary.The index is trading with positive intraday momentum at **7,437.62 (+0.22%)**, advancing through the middle corridor of the pattern.
---
### 🔍 Technical Architecture & Funnel Mechanics:
Our quantitative framework isolates a critical decision apex defined by converging structural trendlines (green boundaries):
1. **Immediate Bullish Leg Within the Funnel (Blue Vector):** Price action is currently rebounding off the ascending support line (green LTA floor near **7,350.00**), driving an impulse leg aimed directly at testing the descending resistance trendline (green LTB ceiling around **7,550.00**).
2. **Breakout & Retest Confirmation Protocol:** As the apex tightens, the market will dictate its next macro direction based on candle closing strength outside the boundaries:
---
### 🛣️ Strategic Dual-Breakout Pathways:
* **Scenario A — Bullish Expansion to All-Time Highs (Blue Arrows):**
* **Mechanics:** A decisive 4-Hour candle close above **7,550.00** accompanied by expanding volume, followed by a successful throwback retest holding the green LTB as new support, confirms a bullish breakout. This unlocks an extended rally toward the upper macro trend channel ceiling (red resistance line) near **7,800.00 – 7,850.00**.
* **Scenario B — Rejection & Deeper Correction (Red Arrows):**
* **Mechanics:** Sell-side absorption at the **7,550.00** upper boundary will push price action back down toward the **7,350.00** support floor. A structural breakdown below this floor invalidates the wedge, triggering a deeper corrective phase toward the institutional **200-period EMA (purple line sitting at 7,273.57)** and secondary liquidity nodes near **7,150.00**.
### 📊 Tactical Parameters Summary:
* **Current Bias:** Neutral / Intraday Rebound Inside Funnel
* **Immediate Target Boundary (Wedge LTB):** ~7,550.00
* **Immediate Support Boundary (Wedge LTA):** ~7,350.00
* **Bullish Expansion Target (Red Line Ceiling):** 7,800.00 – 7,850.00
* **Institutional Risk Baseline (200-EMA):** 7,273.57
---
📊 **ChartPro Data**
*US Equity Architecture, Funnel Compression Mechanics & Systematic Risk Management.*
⚠️ **Disclaimer:** For educational and informational purposes only. This active market study represents a personal trading framework and does not constitute financial or investment advice.

Declinazione di responsabilità
Le informazioni e le pubblicazioni non sono intese come, e non costituiscono, consulenza o raccomandazioni finanziarie, di investimento, di trading o di altro tipo fornite o approvate da TradingView. Per ulteriori informazioni, consultare i Termini di utilizzo.
Declinazione di responsabilità
Le informazioni e le pubblicazioni non sono intese come, e non costituiscono, consulenza o raccomandazioni finanziarie, di investimento, di trading o di altro tipo fornite o approvate da TradingView. Per ulteriori informazioni, consultare i Termini di utilizzo.